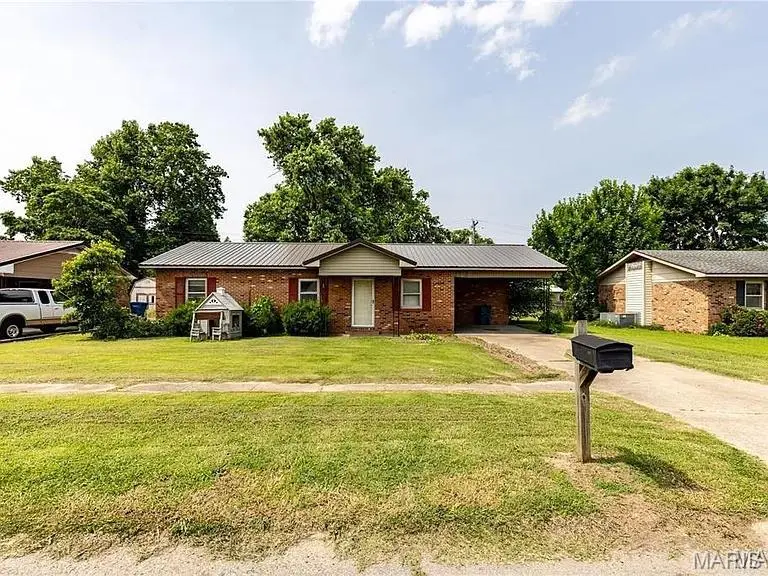
141 Saint Catherine · New Madrid, MO
Flood risk 1/10 · Minimal
- FEMA flood zone
- X
- Chance of flooding over 30 yrs
- 0.0%
- Est. flood insurance / yr
- $507 – $1,088
Fire risk 1/10 · Minimal
- Est. fire insurance / yr
- $1,054 – $1,958
Heat risk 6/10 · Moderate
- Hot days now (above 109°F)
- 7 days/yr
- Hot days in 30 yrs
- 22 days/yr
Wind risk 3/10 · Minor
- Chance of severe wind over 30 yrs
- 6.0%
Air-quality risk 1/10 · Minimal
- Unhealthy air days now
- 0 days/yr
- Unhealthy air days in 30 yrs
- 0 days/yr
Risk factors via First Street. Map © Google.
Why this score? — see what drove the C grade
The composite is a weighted blend of 9 inputs, each scored 0–100. Each bar is that input's sub-score; the figure is the points it added to the 100-point composite (weight × sub-score).
- Cash flow +18.1/30.0
- Appreciation +10.0/10.0
- ARV discount +7.5/15.0
- DSCR +5.7/10.0
- 1% rule +4.1/10.0
- Livability +3.2/5.0
- Rent growth +2.5/5.0
- Condition / age +2.5/5.0
- Schools +2.1/10.0
$99,900
🖨 Deal sheet 📄 Offer letter ✓ Due diligence
Listing remarks MLS
This great home sits in an excellent location! Located in a quiet neighborhood this home has a great layout! Kitchen updated 2020 including stone counter tops and a new metal roof in 2020! This home is perfect for a starter home or an investment property! Call me today for all the details!!!
Key facts
- Metal roof
- Covered carport
- Brick home
Tags
Property features AI
Finance
- Other: No additional financial details provided
- Financial info: No investment or income/expense details provided
- HOA & community: No HOA details provided
Exterior
- Parking: Has a carport (1 space)
- Security: No security details provided
- Utilities: Public water; Public sewer; Electric service (single phase); Cable available; Electricity connected; Sewer connected; Water connected
- Home design: Single-family residence; One story
- Construction: Brick veneer and frame construction; Built year not provided
- Exterior features: Front yard; Back yard; Paved lot features
Interior
- Kitchen: No appliance details provided
- Bedrooms: Three bedrooms, all on the main level
- Flooring: No flooring details provided
- Bathrooms: One full bathroom
- Heating & cooling: Electric forced-air heating; Central air
- Interior features: Central air conditioning; Forced air heating (electric)
- Laundry & utility: No laundry details provided
Neighborhood map
What this means for you Summary
Snapshot
- This is a 3-bed/1.0-bath other listed at $100k.
Deal economics
- At list price, monthly cash flow is $89 ($1k/yr) — positive.
- The deal already cash-flows at list — no discount required.
- To meet the 1% rule (rent ≥ 1% of price), the offer needs to be $91k (9.2% below list).
- Recommended offer: $91k (9.2% below list) — sets the bar for 1% rule.
Location & tenants
- Location reads 64/100 on livability (#309 in MO) — a middle-class / working-renter tenant base. Strengths: cost of living A+, housing B+; Watch: health & safety C-, crime D, amenities F.
- New Madrid County R-I (rural): math 20% / reading 31% proficiency, ranked #291 of 324 in MO (top 90%) — low school quality limits family demand, transient renter base, plan for 1-2y turnover; 63% free/reduced lunch — lower-income household profile, screen leases tightly.
- Zoned schools: New Madrid Elementary (math 37% / reading 32%, grade F, #676 of 1,115 statewide, top 66%, 280 students, 100% FRL); Central High School (math 2% / reading 32%, grade F, #483 of 521 statewide, top 93%, 400 students, 100% FRL) — zoned schools average 100% FRL vs 63% district-wide (37 pts higher); higher-poverty schools than district average — tighter screening recommended.
- Market conditions: 15 active listings in the ZIP; 11 units permitted in New Madrid County in 2024 (0 in 5+ unit buildings).
Forward outlook
- In year one you build about $11k of equity ($691 loan paydown + $10k appreciation (10.0% local appreciation)).
- New Madrid County population projected at -25% by 2050 — secular population decline; favor cash flow + early exit over multi-decade hold.
- At projected returns (10.0% appreciation + 3.0% rent growth), your $28k cash investment doubles in ~3 years — after that, you're playing with house money.
- By year 4, paydown + projected appreciation supports a ~$38k cash-out refi (75% LTV) — recoverable capital for the next deal without selling this one.
Negotiation context
- Only 7 days on market — expect competitive offers; lowballing is unlikely to land.
- 2 sale attempts with the ask held roughly flat each time — persistent listings suggest the price (not the market) is what's stuck; bring a comps-based counter.
Risks & watch-outs
- Climate carrying-cost: extreme-heat days projected 7→22/yr by 2055 (HVAC capex compounding) — expect insurance premiums to compound above CPI over the hold.
Questions for the listing agent
- Built in 1978 — when were the roof, HVAC, electrical panel, plumbing, and water heater last replaced?
- Is there a deadline driving the sale (1031 exchange, divorce, estate, relocation)? That informs how much negotiation room exists.
- Schools are F-rated, which usually means shorter tenancies and higher turnover. Who's the typical renter profile here, and what's been the actual vacancy rate?
- Crime grade is D in this area — have there been break-ins, vandalism, or insurance claims at this property in the last 3 years? What carrier currently insures it and at what premium?
- What's the average days-on-market for RENTAL listings here right now (not sales)? A rising rental-DOM trend means longer vacancies and softer asking-rent achievability than the comps imply.
- What's the recent tenant-quality profile in this submarket — average credit score on applications, eviction rate, late-payment / NSF rate, and stable-employment percentage? A property-management company in the area should have these aggregated.
- How much new for-sale + rental construction is in the pipeline within 1–3 miles? Heavy new supply typically softens prices + rents 12–24 months out; constrained supply supports both.
Investment metrics
- 1% rule
- 0.91% ✗
- Cap rate
- 7.36%
- Cash-on-cash
- 3.80%
- DSCR
- 1.17
- GRM
- 9.2
CMA / ARV
No comps found within radius.
Projected returns pro-forma
10.0% appreciation · 3.0% rent growth · sell at horizon
- IRR
- 27.0%
- Equity multiple
- 3.15×
- Total profit
- $60,022
- Equity at exit
- $89,998
- IRR
- 23.6%
- Equity multiple
- 7.16×
- Total profit
- $172,272
- Equity at exit
- $194,084
Cash invested: $27,972 (down + closing). Projections, not guarantees.
Landlord ↔ Tenant lean methodology
- Overall (STATE)
- 81 Strongly Landlord-Friendly
- State Missouri
- 81 Strongly Landlord-Friendly · R+10
- County
- — inherits STATE
- City
- — inherits STATE
ZIP-level market 63869
- Home prices YoY
- 22.5%
- Active inventory
- 15
- Price-to-rent
- 9.2×
Monthly cashflow live
- Estimated rent
- $907 medium interval (Pro) →
- Mortgage (P&I)
- −$524
- Tax from tax record
- −$63 /mo · $754/yr
- Insurance
- −$42
- HOA
- −$0
- Vacancy / Maint / Mgmt
- −$191
- Net cashflow
- $89
Break-even live
UW: 25.0% down · 7.5% · 30yr · 1.5% tax · 5.0% vac · 8.0% maint · 8.0% mgmt
Financing live
Cash to close
- Down payment
- $24,975
- Closing costs
- $2,997
- Reserves months
- —
- Total cash needed
- —
Loan-product check · same deal, 3 products live
Conventional
25% down · 7.5% · 30yr
- Down + closing
- —
- Monthly P&I
- —
- Monthly cashflow
- —
- DSCR
- —
- Eligible?
- —
Personal DTI + credit; lowest rate.
DSCR
20% down · 8.5% · 30yr
- Down + closing
- —
- Monthly P&I
- —
- Monthly cashflow
- —
- DSCR
- —
- Eligible?
- —
No personal income docs; deal must DSCR.
Hard money
10% down · 12.0% · 12mo
- Down + closing
- —
- Monthly P&I
- —
- Monthly cashflow
- —
- DSCR
- —
- Eligible?
- —
Short-term bridge; refi at stabilization.
Listing history 7 events
-
2026-06-18days on market $99,900 Active 7 DOM
-
2026-06-17days on market $99,900 Active 6 DOM
-
2026-06-16days on market $99,900 Active 5 DOM
-
2026-06-15days on market $99,900 Active 4 DOM
-
2026-06-13days on market $99,900 Active 2 DOM
-
2026-06-12remarks 699-char remark
-
2026-06-12$99,900 Active 1 DOM
ⓘ Source: listings_history table (triggers on properties + properties_extension) + one-shot
backfill from property_details.listing_events for pre-trigger history.
Tax reassessment forecast MO · Resets to sale price
- Current annual tax
- $754 · $63/mo
- Projected year-2 tax
- $969 · $81/mo
- Expected delta
- +$216/yr (+$18/mo · 28.6%)
ⓘ Screening estimate from a state-policy table — verify with the county assessor before closing.
Climate risk First Street
- Flood 1/10 Low FEMA zone X · 0% chance over 30 yrs
- Wildfire 1/10 Low
- Heat 6/10 Major 7 d/yr ≥109°F today · 22 d/yr by 30 yrs out
- Wind 3/10 Moderate 6% chance of damaging wind over 30 yrs
- Air quality 1/10 Low 0 unhealthy d/yr today · 0 by 30 yrs out
Nearby sold comps map
Loading sold comps map…
Walkable amenities ~0.75 mi
Loading nearby amenities…
Taxation est. · year 1
- Rental income
- $10,889
- − Mortgage interest
- −$5,596
- − Property taxes
- −$754
- − Insurance
- −$500
- − Repairs & maintenance
- −$871
- − Management
- −$871
- − Depreciation
- −$2,906
- Taxable loss
- −$609
- Est. tax savings @ 24.0%
- +$146
- After-tax cash flow
- $1,208/yr
For passive investors: Depreciation is non-cash, so a rental often shows a tax loss while cash-flowing — sheltering income. Rental losses are passive: they offset passive income freely, and up to $25,000/yr can offset ordinary (W-2) income if you actively participate and your MAGI is under $100k (phasing out to $0 by $150k); unused losses carry forward. On sale, claimed depreciation is recaptured at up to 25%, and gains may owe capital-gains tax (a 1031 exchange can defer both). Figures are a year-1 estimate at your 24.0% rate — not tax advice; consult a CPA.
Schools (NCES district)
- District
- New Madrid County R-I
- NCES district ID
- 2900004
- Math proficiency
- 20% ▼ -10.00%
- Reading proficiency
- 31% ▼ -7.00%
- Median HH income
- $31,286
- Composite
- 20.64/100
- National rank
- #8543
- State rank
- #291 of 324 in MO
Livability — New Madrid
- Score
- 64/100
- State rank
- #309
- US rank
- #14083
Category grades
Schools grade is shown separately in the Schools card above.
Census & demographics
- Census place
- New Madrid, MO
- Population (ZIP)
- 3,184
Population outlook (New Madrid County) Hauer SSP2
- Today (2025)
- 16,712 people
- By 2030
- 15,845 · -5.2%
- By 2040
- 14,152 · -15.3%
- By 2050
- 12,604 · -24.6%
- By 2075
- 9,478 · -43.3%
- By 2100
- 7,157 · -57.2%
Race, ethnicity, and origin ACS 2023
- Neighborhood character
- Predominantly White (76%)
- Race & ethnicity
- White 76% Black 17% Two or more races 6%
- Common ancestry
- Lithuanian 1% Italian 1%
- Foreign-born
- 1% · South Korea, China
- Languages at home
- 97% English-only · Spanish 2%
Political lean MEDSL · New Madrid
- 2024 margin
- Solid R (+53.5) · D 22.9% · R 76.4%
- 2008→2024 swing
- -38.4pp toward R · 2008: -15.1pp · 2024: -53.5pp
- All cycles
- 2024: R+53.5 2020: R+51.0 2016: R+45.4 2012: R+20.3 2008: R+15.1
Not yet ingested
- Civics
- —
Market trends
- HPI YoY
- ▲ 50.78%
- Current HPI
- 276.21
- Rent YoY
- —
- Metro
- —
- State GDP YoY
- ▲ 1.84%
- F500 in state
- 20
Industry mix (Fortune 500 HQ in MO)
| Industry | F500 HQs | Revenue |
|---|---|---|
| Healthcare | 1 | $163B |
|
||
| Insurance | 1 | $21B |
|
||
| Industrial Technology | 1 | $17B |
|
||
| Retail | 1 | $16B |
|
||
| Industrial Distribution | 1 | $10B |
|
||
| Utilities | 1 | $9B |
|
||
Price history
+5.2% since first listed8 events — show timeline
- 2026-06-11 Listed $99,900 MARIS as Distributed by MLS Grid
- 2025-08-11 Sold (Public Records) — Public Records
- 2025-08-08 Sold (MLS) — MARIS as Distributed by MLS Grid
- 2025-08-08 Pending — MARIS as Distributed by MLS Grid
- 2025-07-11 Contingent — MARIS as Distributed by MLS Grid
- 2025-06-05 Listed $95,000 MARIS as Distributed by MLS Grid
- 2022-04-05 Sold (Public Records) — Public Records
- 2022-04-01 Sold (MLS) — MARIS as Distributed by MLS Grid
Property tax history
+2.3%/yrLatest (2025): $754 · +6.9% YoY. Source: county tax records.
Cash-flow waterfall
monthlySold comps — $/sqft
last 12 mo · ≤1 miLoading sold comps…