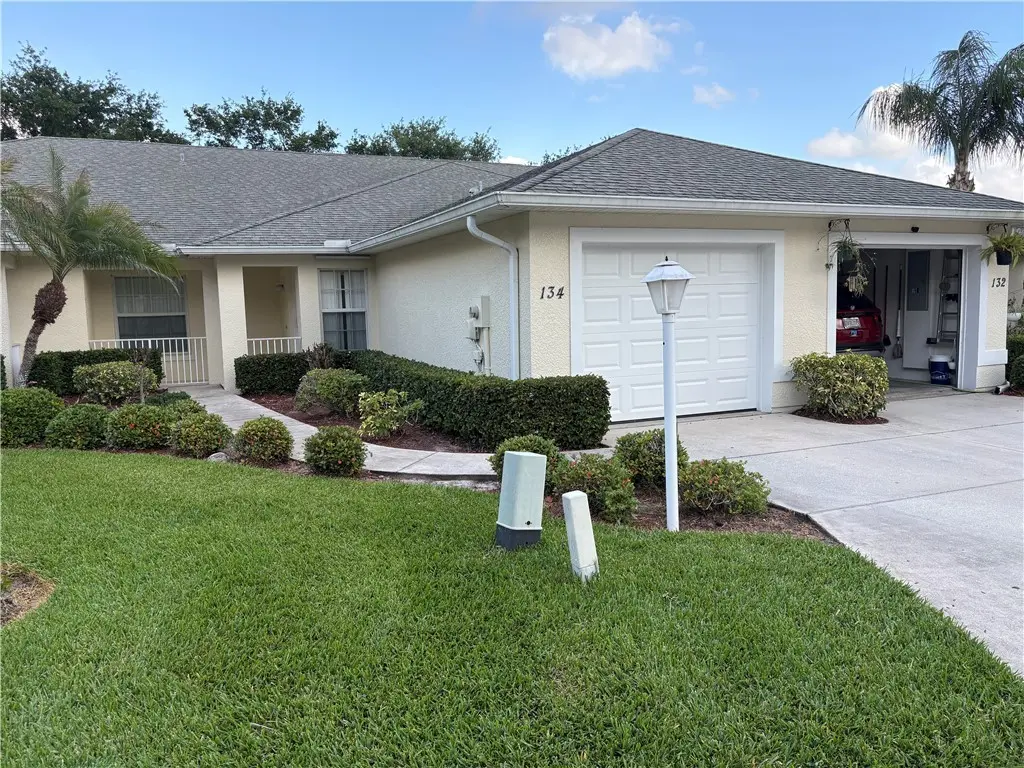
134 Maggie Way
Sebastian, FL 32958
$244,134D+
2 bd · 2.0 ba ·
1,500 sqft ·
Built 2006
· Townhouse
· Active
· 57 DOM
Cashflow @ list (25.0% down · 7.5%)
Estimated rent
$2,067/mo
Mortgage (P&I)
−$1,280
Tax + insurance
−$349
HOA
−$133
Vac / Maint / Mgmt
−$434
Net cashflow
$-129/mo
Annual
$-1,546/yr
Cap rate
5.66%
Cash-on-cash
-2.26%
DSCR
0.90
1% rule
0.85%
Cash to close
$68,358
Investor read
- This is a 2-bed/2.0-bath townhouse listed at $244k.
- At list price, monthly cash flow is $-129 ($-2k/yr) — negative.
- To cash-flow at today's rent, offer at most $221k (9.3% below list).
- To meet the 1% rule (rent ≥ 1% of price), the offer needs to be $207k (15.3% below list).
- It's been on market 57 days — a 3% lower offer ($237k) is reasonable based on typical stale-listing flexibility.
- Recommended offer: $207k (15.3% below list) — sets the bar for 1% rule.
- Local home prices are declining (-3.0%/yr); year-one equity from $2k of loan paydown is wiped out by about $7k of value loss. Plan a longer hold.
- Location reads 81/100 on livability (#89 in FL, #1,421 nationally) — a professional / high-income tenant draw. Strengths: housing A+, crime A, health & safety A; Watch: schools D+, amenities D-.
- Indian River (other): math 48% / reading 52% proficiency, ranked #35 of 73 in FL (top 48%) — acceptable for families but not a draw, mixed tenant base, ~2y average lease.
- Market conditions: Rents rising fast (+6.2%/yr); 412 active listings in the ZIP; 13 comparable units currently listed for rent nearby; rentals leasing fast (median 14d on market — plan ~1-2 weeks tenant-placement turnaround); 564 units permitted in Indian River County in 2024 (281 in 5+ unit buildings).
- Indian River County population projected at +18% by 2050 — long-run rental-demand tailwind backs the buy-and-hold thesis.
- 7 sale attempts since 5y ago with the ask held roughly flat each time — persistent listings suggest the price (not the market) is what's stuck; bring a comps-based counter.
- Current owner paid $195k; 25% above their basis — modest negotiation headroom, anchor on the comps not their cost.
- Climate carrying-cost: severe wind risk, 99% chance of damaging wind over 30y; extreme-heat days projected 7→24/yr by 2055 (HVAC capex compounding) — expect insurance premiums to compound above CPI over the hold.
- Cap rate 5.7% vs local median 4.4% in Sebastian — meaningfully above typical; check what's discounted (condition, days-on-market, listing class) to confirm the premium yield is real.
- This rent runs 37% of the median local income ($67k/yr) — at the standard rent-burdened threshold; future hikes will face affordability resistance.
Questions for listing agent
- What do current leases actually rent for vs. the listed asking? Can we see a recent rent roll and the last 12 months of T-12 income?
- It's been on market 57 days. Have you received any prior offers? Is the seller open to a 15% concession, seller financing, or rate buy-down credit?
- What does the HOA fee cover, when was the last increase, and are there any pending special assessments or reserve-fund shortfalls?
- Is there a deadline driving the sale (1031 exchange, divorce, estate, relocation)? That informs how much negotiation room exists.
- Schools are D-rated, which usually means shorter tenancies and higher turnover. Who's the typical renter profile here, and what's been the actual vacancy rate?
- The area grade is low — what's the realistic commute time and amenity access for the typical tenant pool here? Any planned neighborhood developments (good or bad) we should know about?
- What's the average days-on-market for RENTAL listings here right now (not sales)? A rising rental-DOM trend means longer vacancies and softer asking-rent achievability than the comps imply.
- What's the recent tenant-quality profile in this submarket — average credit score on applications, eviction rate, late-payment / NSF rate, and stable-employment percentage? A property-management company in the area should have these aggregated.
CashFlowRE · CFR-APTSXT9Q9B3KJ3
· Data 1 day ago
cashflowre.app · 2026-05-29