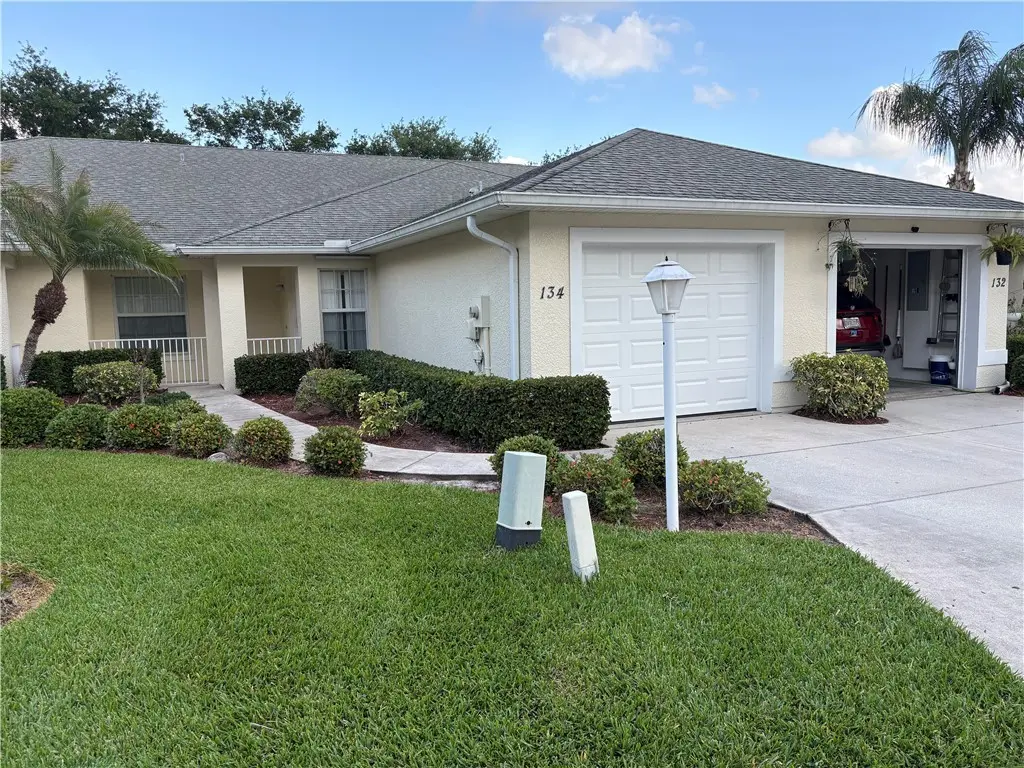
134 Maggie Way · Sebastian, FL
Flood risk 1/10 · Minimal
- FEMA flood zone
- X (unshaded)
- Chance of flooding over 30 yrs
- 0.0%
- Est. flood insurance / yr
- $507 – $1,088
Fire risk 3/10 · Minor
- Est. fire insurance / yr
- $947 – $1,759
Heat risk 10/10 · Severe
- Hot days now (above 106°F)
- 7 days/yr
- Hot days in 30 yrs
- 24 days/yr
Wind risk 10/10 · Severe
- Chance of severe wind over 30 yrs
- 99.0%
Air-quality risk 1/10 · Minimal
- Unhealthy air days now
- 0 days/yr
- Unhealthy air days in 30 yrs
- 0 days/yr
Risk factors via First Street. Map © Google.
Why this score? — see what drove the D+ grade
The composite is a weighted blend of 9 inputs, each scored 0–100. Each bar is that input's sub-score; the figure is the points it added to the 100-point composite (weight × sub-score).
- ARV discount +15.0/15.0
- Cash flow +10.4/30.0
- Schools +4.2/10.0
- Rent growth +4.1/5.0
- Livability +4.0/5.0
- 1% rule +3.5/10.0
- DSCR +3.0/10.0
- Condition / age +2.5/5.0
- Appreciation +0.0/10.0
$244,134
🖨 Deal sheet 📄 Offer letter ✓ Due diligence
Listing remarks
Affordable excellence… you just discover Sandridge Estates. Sebastians best keep secret. All homes in harmony w/ each other, tastefully landscaped, beautiful oak tree lined streets. Your new staycation is vacant we can close next Friday @_____. 2 comfortable sized bed rooms + an office /study/hobby rm or u decide. .. Yes, could be a 3rd bedroom!Life is good. Screened in lanai w/ some space beween u & your back neighbors. 1 car garage. Sandy ocean beachs 13 minutes away. Enjoy the Indian River water front 6 minutes away. Got golf 8 minutes + \ -. Take the dare shop & compare. Affordable HOA, !-95 9 mins. plus &
Key facts
- $133 HOA
- Garage
- Built 2006
Property features AI
Finance
- Financial info: Pets allowed with restrictions (breed and number limits)
- HOA & community: Affordable association; Monthly association fee of $133; Association covers common areas, grounds maintenance and structure maintenance; Dues paid quarterly
Exterior
- Parking: Attached garage; Driveway; Garage door opener; 1 garage space
- Security: Smoke detectors
- Utilities: Public water; County sewer
- Home design: Single-story home; Faces west; Property attached
- Construction: Block, concrete and stucco construction; Shingle roof; Built on standard foundation
- Exterior features: Enclosed porch; Porch with screened area; Paved road access
Interior
- Kitchen: Range; Refrigerator; Electric water heater
- Bedrooms: Bedroom 1 (12 x 11); Bedroom 2 (14 x 12)
- Bathrooms: 2 full bathrooms
- Heating & cooling: Central heating (electric); Central air conditioning (electric); Ceiling fans
- Interior features: High ceilings with vaulted areas; French doors / atrium doors; Window treatments; Unfurnished
- Laundry & utility: In-unit laundry
Neighborhood map
What this means for you Summary
Snapshot
- This is a 2-bed/2.0-bath townhouse listed at $244k.
Deal economics
- At list price, monthly cash flow is $-129 ($-2k/yr) — negative.
- To cash-flow at today's rent, offer at most $221k (9.3% below list).
- To meet the 1% rule (rent ≥ 1% of price), the offer needs to be $207k (15.3% below list).
- Recommended offer: $207k (15.3% below list) — sets the bar for 1% rule.
- Cap rate 5.7% vs local median 4.4% in Sebastian — meaningfully above typical; check what's discounted (condition, days-on-market, listing class) to confirm the premium yield is real.
Location & tenants
- Location reads 81/100 on livability (#89 in FL, #1,421 nationally) — a professional / high-income tenant draw. Strengths: housing A+, crime A, health & safety A; Watch: schools D+, amenities D-.
- Indian River (other): math 48% / reading 52% proficiency, ranked #35 of 73 in FL (top 48%) — acceptable for families but not a draw, mixed tenant base, ~2y average lease.
- Market conditions: Rents rising fast (+6.2%/yr); 412 active listings in the ZIP; 13 comparable units currently listed for rent nearby; rentals leasing fast (median 14d on market — plan ~1-2 weeks tenant-placement turnaround); 564 units permitted in Indian River County in 2024 (281 in 5+ unit buildings).
- This rent runs 37% of the median local income ($67k/yr) — at the standard rent-burdened threshold; future hikes will face affordability resistance.
Forward outlook
- Local home prices are declining (-3.0%/yr); year-one equity from $2k of loan paydown is wiped out by about $7k of value loss. Plan a longer hold.
- Indian River County population projected at +18% by 2050 — long-run rental-demand tailwind backs the buy-and-hold thesis.
Negotiation context
- It's been on market 57 days — a 3% lower offer ($237k) is reasonable based on typical stale-listing flexibility.
- 7 sale attempts since 5y ago with the ask held roughly flat each time — persistent listings suggest the price (not the market) is what's stuck; bring a comps-based counter.
- Current owner paid $195k; 25% above their basis — modest negotiation headroom, anchor on the comps not their cost.
Risks & watch-outs
- Climate carrying-cost: severe wind risk, 99% chance of damaging wind over 30y; extreme-heat days projected 7→24/yr by 2055 (HVAC capex compounding) — expect insurance premiums to compound above CPI over the hold.
Questions for the listing agent
- What do current leases actually rent for vs. the listed asking? Can we see a recent rent roll and the last 12 months of T-12 income?
- It's been on market 57 days. Have you received any prior offers? Is the seller open to a 15% concession, seller financing, or rate buy-down credit?
- What does the HOA fee cover, when was the last increase, and are there any pending special assessments or reserve-fund shortfalls?
- Is there a deadline driving the sale (1031 exchange, divorce, estate, relocation)? That informs how much negotiation room exists.
- Schools are D-rated, which usually means shorter tenancies and higher turnover. Who's the typical renter profile here, and what's been the actual vacancy rate?
- The area grade is low — what's the realistic commute time and amenity access for the typical tenant pool here? Any planned neighborhood developments (good or bad) we should know about?
- What's the average days-on-market for RENTAL listings here right now (not sales)? A rising rental-DOM trend means longer vacancies and softer asking-rent achievability than the comps imply.
- What's the recent tenant-quality profile in this submarket — average credit score on applications, eviction rate, late-payment / NSF rate, and stable-employment percentage? A property-management company in the area should have these aggregated.
- How much new for-sale + rental construction is in the pipeline within 1–3 miles? Heavy new supply typically softens prices + rents 12–24 months out; constrained supply supports both.
Investment metrics
- 1% rule
- 0.85% ✗
- Cap rate
- 5.66%
- Cash-on-cash
- -2.26%
- DSCR
- 0.90
- GRM
- 9.8
CMA / ARV
- ARV (on-the-fly)
- $298,500
- Comps found
- 2
Show comp detail 2 sales within ~0.75 mi
| Address | Dist | Beds/Ba | Sqft | Sold | Price | $/sf | Match |
|---|---|---|---|---|---|---|---|
| 952 S Easy St | 0.06mi | 2/2.0 | 1,379 (-8%) | 11mo | $275,000 | $199 | 74 |
| 996 S Easy St | 0.13mi | 3/2.0 (+1) | 1,373 (-8%) | 7mo | $235,000 | $171 | 70 |
Match score weights: distance 35% · size 25% · config 20% · recency 20%. Top-matched comps best support the ARV.
Projected returns pro-forma
-3.0% appreciation · 6.22% rent growth · sell at horizon
- IRR
- -16.3%
- Equity multiple
- 0.40×
- Total profit
- $-40,778
- Equity at exit
- $36,401
- IRR
- -2.9%
- Equity multiple
- 0.77×
- Total profit
- $-15,455
- Equity at exit
- $21,108
Cash invested: $68,358 (down + closing). Projections, not guarantees.
Landlord ↔ Tenant lean methodology
- Overall (STATE)
- 87 Strongly Landlord-Friendly
- State Florida
- 87 Strongly Landlord-Friendly · R+3
- County
- — inherits STATE
- City
- — inherits STATE
ZIP-level market 32958
- Home prices YoY
- -13.1%
- Rents YoY
- 6.2%
- Active inventory
- 412
- Price-to-rent
- 9.8×
Monthly cashflow live
- Estimated rent
- $2,067 high interval (Pro) →
- Mortgage (P&I)
- −$1,280
- Tax from tax record
- −$247 /mo · $2,962/yr
- Insurance
- −$102
- HOA
- −$133
- Vacancy / Maint / Mgmt
- −$434
- Net cashflow
- $-129
Break-even live
UW: 25.0% down · 7.5% · 30yr · 1.5% tax · 5.0% vac · 8.0% maint · 8.0% mgmt
Financing live
Cash to close
- Down payment
- $61,034
- Closing costs
- $7,324
- Reserves months
- —
- Total cash needed
- —
Loan-product check · same deal, 3 products live
Conventional
25% down · 7.5% · 30yr
- Down + closing
- —
- Monthly P&I
- —
- Monthly cashflow
- —
- DSCR
- —
- Eligible?
- —
Personal DTI + credit; lowest rate.
DSCR
20% down · 8.5% · 30yr
- Down + closing
- —
- Monthly P&I
- —
- Monthly cashflow
- —
- DSCR
- —
- Eligible?
- —
No personal income docs; deal must DSCR.
Hard money
10% down · 12.0% · 12mo
- Down + closing
- —
- Monthly P&I
- —
- Monthly cashflow
- —
- DSCR
- —
- Eligible?
- —
Short-term bridge; refi at stabilization.
Rent comps 13 comps
| Address | Beds | Baths | Sqft | Rent | $/sqft | DOM | Units | Dist |
|---|---|---|---|---|---|---|---|---|
| 186 Empress Ave Unit B Sebastian, FL | 2.0 | 2.0 | 1398 | $1,575 | $1.13 | 21d | 1 | 0.14mi |
| 151 Mabry St Sebastian, FL | 3.0 | 2.0 | 1199 | $1,850 | $1.54 | 21d | 1 | 0.45mi |
| 141 Crawford Dr Sebastian, FL | 2.0 | 1.0 | 1100 | $2,200 | $2.00 | 13d | 1 | 0.51mi |
| 155 Midvale Ter Sebastian, FL | 3.0 | 2.0 | 1853 | $3,000 | $1.62 | 21d | 1 | 0.52mi |
| 1421 Thornhill Ln Sebastian, FL | 3.0 | 2.0 | 1216 | $2,800 | $2.30 | 13d | 1 | 0.58mi |
| 366 Joy Haven Dr Sebastian, FL | 3.0 | 2.0 | 1885 | $2,095 | $1.11 | 13d | 1 | 1.07mi |
| 426 Tulip Dr Sebastian, FL | 2.0 | 2.0 | 1161 | $2,100 | $1.81 | 21d | 1 | 1.08mi |
| 1565 Glentry Ln Sebastian, FL | 2.0 | 2.0 | 1189 | $2,500 | $2.10 | 13d | 1 | 1.14mi |
| 1110 Barber St Sebastian, FL | 3.0 | 2.0 | 1324 | $2,200 | $1.66 | 13d | 1 | 1.16mi |
| 834 Dolores St Sebastian, FL | 3.0 | 1.0 | 1253 | $1,600 | $1.28 | 13d | 1 | 1.19mi |
| 632 Bayfront Ter Sebastian, FL | 3.0 | 2.0 | 1885 | $2,350 | $1.25 | 13d | 1 | 1.22mi |
| 832 Carnation Dr Sebastian, FL | 3.0 | 2.0 | 1400 | $2,800 | $2.00 | 13d | 1 | 1.33mi |
| 742 Capon Ter Sebastian, FL | 2.0 | 2.0 | 1080 | $2,000 | $1.85 | 21d | 1 | 1.46mi |
HOA detail
- Monthly dues
- $133 · $1,596/yr
- Likely covers
- water
Listing history 41 events
-
2026-06-19days on market $244,134 Active 57 DOM
-
2026-06-18price $244,134 Active 56 DOM
-
2026-06-18days on market $245,134 Active 56 DOM
-
2026-06-17days on market $245,134 Active 55 DOM
-
2026-06-16days on market $245,134 Active 54 DOM
-
2026-06-15days on market $245,134 Active 53 DOM
-
2026-06-14days on market $245,134 Active 51 DOM
-
2026-06-13pricedays on market $245,134 Active 50 DOM
-
2026-06-10days on market $246,134 Active 48 DOM
-
2026-06-09days on market $246,134 Active 47 DOM
-
2026-06-08days on market $246,134 Active 46 DOM
-
2026-06-07pricedays on market $246,134 Active 45 DOM
-
2026-06-05days on market $247,134 Active 42 DOM
-
2026-06-02days on market $247,134 Active 40 DOM
-
2026-06-01days on market $247,134 Active 39 DOM
-
2026-05-31days on market $247,134 Active 38 DOM
-
2026-05-30days on market $247,134 Active 37 DOM
-
2026-05-22price $248,134
-
2026-05-14price $249,134
-
2026-04-23$250,000 Active
-
2026-04-14historical $250,000
-
2026-01-03historical
-
2026-01-02historical
-
2025-10-27price $245,000
-
2025-10-27price $245,000
-
2025-10-27price $245,000
-
2025-08-12price $260,000
-
2025-08-12price $260,000
-
2025-08-12price $260,000
-
2025-07-16price $272,000
-
2025-07-16price $272,000
-
2025-07-16price $272,000
-
2025-07-03$284,000 Active
-
2025-07-03$284,000 Active
-
2025-07-02$284,000 Active
-
2021-07-13soldstatus $195,000
-
2021-07-12soldstatus $195,000 Closed
-
2021-05-23historical Active Under Contract
-
2021-05-18$195,000 Active
-
2021-05-18$195,000 Active
-
2021-05-11$195,000 Active
ⓘ Source: listings_history table (triggers on properties + properties_extension) + one-shot
backfill from property_details.listing_events for pre-trigger history.
Tax reassessment forecast FL · Resets to sale price
- Current annual tax
- $2,962 · $247/mo
- Projected year-2 tax
- $2,962 · $247/mo
- Expected delta
- $0/yr ($0/mo · 0.0%)
ⓘ Screening estimate from a state-policy table — verify with the county assessor before closing.
Climate risk First Street
- Flood 1/10 Low FEMA zone X (unshaded) · 0% chance over 30 yrs
- Wildfire 3/10 Moderate
- Heat 10/10 Extreme 7 d/yr ≥106°F today · 24 d/yr by 30 yrs out
- Wind 10/10 Extreme 99% chance of damaging wind over 30 yrs
- Air quality 1/10 Low 0 unhealthy d/yr today · 0 by 30 yrs out
Nearby sold comps map
Loading sold comps map…
Walkable amenities ~0.75 mi
Loading nearby amenities…
Taxation est. · year 1
- Rental income
- $24,805
- − Mortgage interest
- −$13,675
- − Property taxes
- −$2,962
- − Insurance
- −$1,221
- − Repairs & maintenance
- −$1,984
- − Management
- −$1,984
- − HOA
- −$1,596
- − Depreciation
- −$7,102
- Taxable loss
- −$5,720
- Est. tax savings @ 24.0%
- +$1,373
- After-tax cash flow
- $-173/yr
For passive investors: Depreciation is non-cash, so a rental often shows a tax loss while cash-flowing — sheltering income. Rental losses are passive: they offset passive income freely, and up to $25,000/yr can offset ordinary (W-2) income if you actively participate and your MAGI is under $100k (phasing out to $0 by $150k); unused losses carry forward. On sale, claimed depreciation is recaptured at up to 25%, and gains may owe capital-gains tax (a 1031 exchange can defer both). Figures are a year-1 estimate at your 24.0% rate — not tax advice; consult a CPA.
Schools (NCES district)
- District
- Indian River
- NCES district ID
- 1200930
- Math proficiency
- 48% ▼ -9.00%
- Reading proficiency
- 52% ▼ -3.00%
- Median HH income
- $46,597
- Composite
- 42.45/100
- National rank
- #3218
- State rank
- #35 of 73 in FL
Livability — Sebastian
- Score
- 81/100
- State rank
- #89
- US rank
- #1421
Category grades
Schools grade is shown separately in the Schools card above.
Census & demographics
- Census place
- Sebastian, FL
- County
- Indian River County · 143,738 people
- City population
- 30,023
- Metro
- Sebastian-Vero Beach, FL
- Population (ZIP)
- 30,023
- Household income
- $66,840
- Rent vs Own
- Severe rent burden
- 646.0
Population outlook (Indian River County) Hauer SSP2
- Today (2025)
- 165,104 people
- By 2030
- 172,869 · +4.7%
- By 2040
- 185,640 · +12.4%
- By 2050
- 194,465 · +17.8%
- By 2075
- 211,115 · +27.9%
- By 2100
- 211,781 · +28.3%
Race, ethnicity, and origin ACS 2023
- Neighborhood character
- Predominantly White (86%)
- Race & ethnicity
- White 86% Hispanic / Latino 9% Two or more races 7% Black 2% Asian 1%
- Hispanic origin (detail)
- Mexican 1% Puerto Rican 2% Cuban 3%
- Common ancestry
- Lithuanian 4% Slovak 4% Romanian 3%
- Foreign-born
- 7% · Canada, Jamaica
- Languages at home
- 91% English-only · Spanish 6% Other Indo-European 1% Russian/Polish/Slavic 1%
Political lean MEDSL · Indian River
- 2024 margin
- Strong R (+27.4) · D 36.0% · R 63.4%
- 2008→2024 swing
- -12.5pp toward R · 2008: -14.8pp · 2024: -27.4pp
- All cycles
- 2024: R+27.4 2020: R+21.6 2016: R+24.5 2012: R+22.3 2008: R+14.8
Not yet ingested
- Civics
- —
Market trends
- HPI YoY
- ▼ -49.85%
- Current HPI
- 330.1691
- Rent YoY
- ▲ 6.22%
- Metro
- Sebastian-Vero Beach, FL
- State GDP YoY
- ▲ 3.28%
- F500 in state
- 36
Industry mix (Fortune 500 HQ in FL)
| Industry | F500 HQs | Revenue |
|---|---|---|
| Industrial Technology | 2 | $29B |
|
||
| Insurance | 2 | $17B |
|
||
| Retail | 1 | $60B |
|
||
| Technology Distribution | 1 | $58B |
|
||
| Homebuilding | 1 | $35B |
|
||
| Technology Manufacturing | 1 | $35B |
|
||
Price history
+27.2% since first listed24 events — show timeline
- 2026-05-22 Price Changed $248,134 RAIRCMLS
- 2026-05-14 Price Changed $249,134 RAIRCMLS
- 2026-04-23 Listed $250,000 RAIRCMLS
- 2026-04-14 Coming Soon $250,000 RAIRCMLS
- 2026-01-03 Listing Removed — Beaches MLS
- 2026-01-02 Listing Removed — SCMLS
- 2025-10-27 Price Changed $245,000 Beaches MLS
- 2025-10-27 Price Changed $245,000 SCMLS
- 2025-10-27 Price Changed $245,000 RAIRCMLS
- 2025-08-12 Price Changed $260,000 Beaches MLS
- 2025-08-12 Price Changed $260,000 SCMLS
- 2025-08-12 Price Changed $260,000 RAIRCMLS
- 2025-07-16 Price Changed $272,000 Beaches MLS
- 2025-07-16 Price Changed $272,000 SCMLS
- 2025-07-16 Price Changed $272,000 RAIRCMLS
- 2025-07-03 Listed $284,000 SCMLS
- 2025-07-03 Listed $284,000 Beaches MLS
- 2025-07-02 Listed $284,000 RAIRCMLS
- 2021-07-13 Sold (Public Records) $195,000 Public Records
- 2021-07-12 Sold (MLS) $195,000 RAIRCMLS
- 2021-05-23 Contingent — RAIRCMLS
- 2021-05-18 Listed $195,000 Beaches MLS
- 2021-05-18 Listed $195,000 SCMLS
- 2021-05-11 Listed $195,000 RAIRCMLS
Property tax history
+5.9%/yrLatest (2025): $2,962 · +4.5% YoY. Source: county tax records.
Cash-flow waterfall
monthlySold comps — $/sqft
last 12 mo · ≤1 miLoading sold comps…