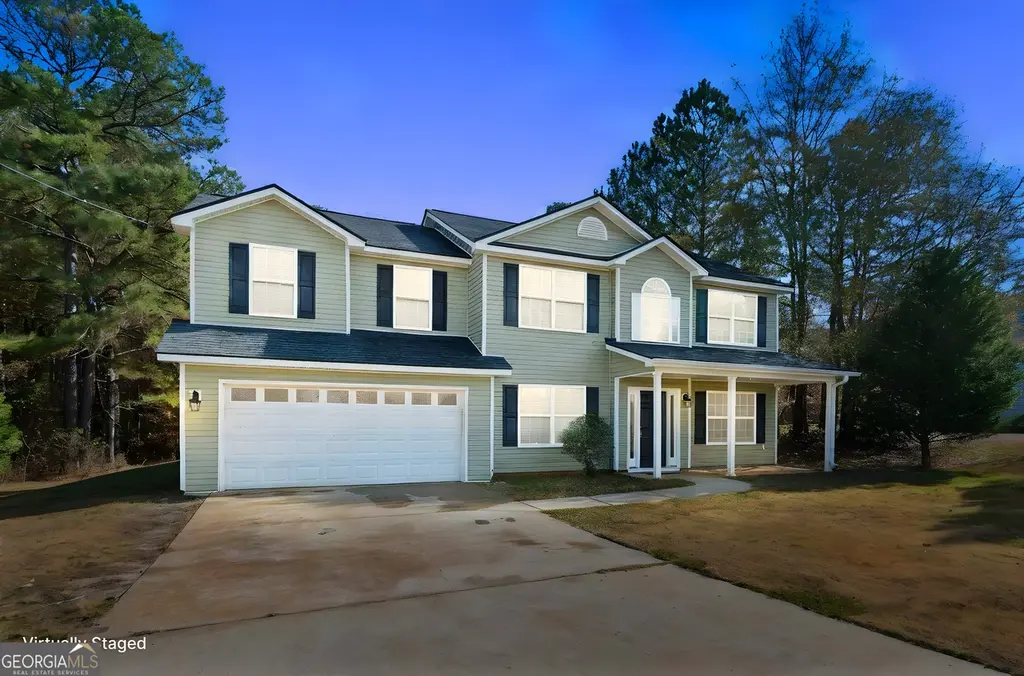
403 Avant Rd
Eatonton, GA 31024
$309,995D+
4 bd · 3.5 ba ·
2,796 sqft ·
Built 2008
· SingleFamily
· Active
· 180 DOM
Cashflow @ list (25.0% down · 7.5%)
Estimated rent
$2,526/mo
Mortgage (P&I)
−$1,626
Tax + insurance
−$295
HOA
−$0
Vac / Maint / Mgmt
−$530
Net cashflow
$75/mo
Annual
$899/yr
Cap rate
6.58%
Cash-on-cash
1.04%
DSCR
1.05
1% rule
0.81%
Cash to close
$86,799
Investor read
- This is a 4-bed/3.5-bath single-family listed at $310k.
- At list price, monthly cash flow is $75 ($899/yr) — positive.
- The deal already cash-flows at list — no discount required.
- To meet the 1% rule (rent ≥ 1% of price), the offer needs to be $253k (18.5% below list).
- It's been on market 180 days — a 12% lower offer ($273k) is reasonable based on typical stale-listing flexibility.
- Recommended offer: $253k (18.5% below list) — sets the bar for 1% rule.
- Local home prices are declining (-3.0%/yr); year-one equity from $2k of loan paydown is wiped out by about $9k of value loss. Plan a longer hold.
- Location reads 71/100 on livability (#76 in GA) — a middle-class / working-renter tenant base. Strengths: cost of living A+, housing A+, crime A; Watch: schools F, amenities F, commute F.
- Putnam County (rural): math 33% / reading 30% proficiency, ranked #86 of 174 in GA (top 49%) — families likely to look elsewhere, expect single-tenant / working-renter base with shorter leases; 69% free/reduced lunch — lower-income household profile, screen leases tightly.
- Market conditions: 522 active listings in the ZIP; 129 units permitted in Putnam County in 2024 (50 in 5+ unit buildings).
- Putnam County population projected at -18% by 2050 — secular population decline; favor cash flow + early exit over multi-decade hold.
- 6 sale attempts; this cycle's ask has dropped $65k (17%) from the opening price — seller is motivated, your offer sets the floor, not the list.
- Climate carrying-cost: major wind risk, 45% chance of damaging wind over 30y; extreme-heat days projected 7→17/yr by 2055 (HVAC capex compounding) — expect insurance premiums to compound above CPI over the hold.
- Cap rate 6.6% vs local median 4.2% in Eatonton — top-decile yield for the area; either an underpriced asset or a hidden risk that comps aren't pricing in. Stress-test before assuming the spread holds.
- At $2,526/mo this rent would consume 46% of the median local household income ($66k/yr) (locally 696% of renters already pay >50% of income on rent) — very limited rent-growth headroom before tenants either downsize or default.
Questions for listing agent
- It's been on market 180 days. Have you received any prior offers? Is the seller open to a 19% concession, seller financing, or rate buy-down credit?
- Why hasn't it sold? Are there any deal-killer items the seller is aware of (foundation, flood, title, zoning, code violations)?
- Is there a deadline driving the sale (1031 exchange, divorce, estate, relocation)? That informs how much negotiation room exists.
- Schools are F-rated, which usually means shorter tenancies and higher turnover. Who's the typical renter profile here, and what's been the actual vacancy rate?
- The area grade is low — what's the realistic commute time and amenity access for the typical tenant pool here? Any planned neighborhood developments (good or bad) we should know about?
- What's the average days-on-market for RENTAL listings here right now (not sales)? A rising rental-DOM trend means longer vacancies and softer asking-rent achievability than the comps imply.
- What's the recent tenant-quality profile in this submarket — average credit score on applications, eviction rate, late-payment / NSF rate, and stable-employment percentage? A property-management company in the area should have these aggregated.
- How much new for-sale + rental construction is in the pipeline within 1–3 miles? Heavy new supply typically softens prices + rents 12–24 months out; constrained supply supports both.
CashFlowRE · CFR-ARK0S3F2ZQJ1QZ
· Data 1 day ago
cashflowre.app · 2026-05-29