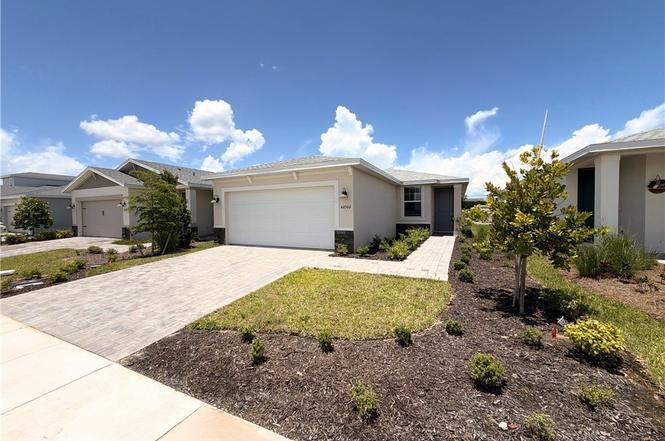
44500 Cable Creek Dr
North Fort Myers, FL 33982
$274,999D-
3 bd · 2.0 ba ·
1,280 sqft ·
Built 2024
· Land
· Pending
· 99 DOM
Cashflow @ list (25.0% down · 7.5%)
Estimated rent
$2,653/mo
Mortgage (P&I)
−$1,442
Tax + insurance
−$614
HOA
−$337
Vac / Maint / Mgmt
−$557
Net cashflow
$-297/mo
Annual
$-3,565/yr
Cap rate
5.00%
Cash-on-cash
-4.63%
DSCR
0.79
1% rule
0.96%
Cash to close
$77,000
Investor read
- This is a 3-bed/2.0-bath land listed at $275k.
- At list price, monthly cash flow is $-297 ($-4k/yr) — negative.
- To cash-flow at today's rent, offer at most $223k (19.1% below list).
- To meet the 1% rule (rent ≥ 1% of price), the offer needs to be $265k (3.5% below list).
- It's been on market 99 days — a 9% lower offer ($250k) is reasonable based on typical stale-listing flexibility.
- Recommended offer: $223k (19.1% below list) — sets the bar for cash-flow.
- Local home prices are declining (-3.0%/yr); year-one equity from $2k of loan paydown is wiped out by about $8k of value loss. Plan a longer hold.
- Location reads 74/100 on livability (#269 in FL, #4,409 nationally) — a middle-class / working-renter tenant base. Strengths: cost of living A+, housing A+, health & safety A+; Watch: employment C-, amenities F, commute F.
- Charlotte (suburban): math 54% / reading 54% proficiency, ranked #22 of 73 in FL (top 30%) — acceptable for families but not a draw, mixed tenant base, ~2y average lease.
- Market conditions: Rents rising fast (+4.1%/yr); 1037 active listings in the ZIP; 40 comparable units currently listed for rent nearby; rentals at typical pace (median 22d on market — plan ~3-4 weeks tenant-placement turnaround); 4,585 units permitted in Charlotte County in 2024 (703 in 5+ unit buildings).
- Charlotte County population projected at +24% by 2050 — long-run rental-demand tailwind backs the buy-and-hold thesis.
- 6 sale attempts since 2y ago; this cycle's ask has dropped $15k (5%) from the opening price — seller is motivated, your offer sets the floor, not the list.
- Cap rate 5.0% vs local median 3.6% in North Fort Myers — top-decile yield for the area; either an underpriced asset or a hidden risk that comps aren't pricing in. Stress-test before assuming the spread holds.
- This rent runs 44% of the median local income ($72k/yr) — at the standard rent-burdened threshold; future hikes will face affordability resistance.
Questions for listing agent
- What do current leases actually rent for vs. the listed asking? Can we see a recent rent roll and the last 12 months of T-12 income?
- It's been on market 99 days. Have you received any prior offers? Is the seller open to a 19% concession, seller financing, or rate buy-down credit?
- What does the HOA fee cover, when was the last increase, and are there any pending special assessments or reserve-fund shortfalls?
- Why hasn't it sold? Are there any deal-killer items the seller is aware of (foundation, flood, title, zoning, code violations)?
- Is there a deadline driving the sale (1031 exchange, divorce, estate, relocation)? That informs how much negotiation room exists.
- The area grade is low — what's the realistic commute time and amenity access for the typical tenant pool here? Any planned neighborhood developments (good or bad) we should know about?
- What's the average days-on-market for RENTAL listings here right now (not sales)? A rising rental-DOM trend means longer vacancies and softer asking-rent achievability than the comps imply.
- What's the recent tenant-quality profile in this submarket — average credit score on applications, eviction rate, late-payment / NSF rate, and stable-employment percentage? A property-management company in the area should have these aggregated.
CashFlowRE · CFR-AS31QQ6981DDB5
· Data 6 days ago
cashflowre.app · 2026-05-29