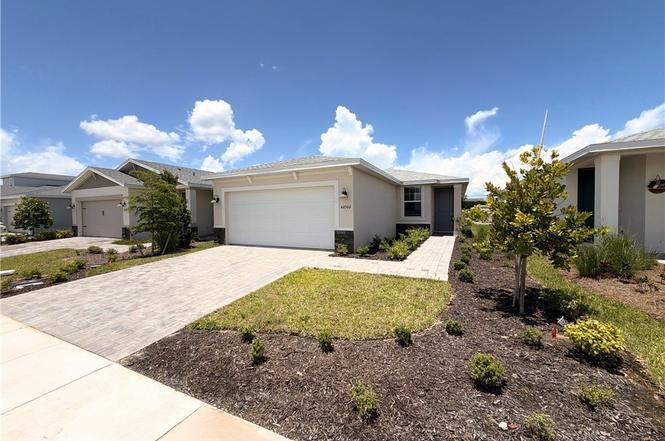
44500 Cable Creek Dr · North Fort Myers, FL
Flood risk No data
- FEMA flood zone
- —
- Chance of flooding over 30 yrs
- —
- Est. flood insurance / yr
- —
Fire risk No data
- Est. fire insurance / yr
- —
Heat risk No data
- Hot days now (above threshold)
- —
- Hot days in 30 yrs
- —
Wind risk No data
- Chance of severe wind over 30 yrs
- —
Air-quality risk No data
- Unhealthy air days now
- —
- Unhealthy air days in 30 yrs
- —
Risk factors via First Street. Map © Google.
Why this score? — see what drove the D- grade
The composite is a weighted blend of 9 inputs, each scored 0–100. Each bar is that input's sub-score; the figure is the points it added to the 100-point composite (weight × sub-score).
- Cash flow +7.9/30.0
- ARV discount +7.5/15.0
- 1% rule +4.6/10.0
- Schools +4.6/10.0
- Livability +3.7/5.0
- Rent growth +3.5/5.0
- Condition / age +2.5/5.0
- Appreciation +2.4/10.0
- DSCR +1.9/10.0
$274,999
🖨 Deal sheet 📄 Offer letter ✓ Due diligence
Listing remarks
Upgrades include all appliances, window blinds, smart home technology, and quartz countertops! Welcome to the new construction Crescent Lakes, offering a spacious 3 bed, 2 bath home with 1,269 sq. ft. of luxurious living space. featuring all block construction and spray foam insulation to ensure a comfortable and cost-effective living environment year-round. Prepare dinner while catching up on the day’s events from this home's chef-inspired kitchen which overlooks a great room and dining area. Well-appointed primary suite provides a restful retreat at the end of the day and has a spacious walk-in closet. Crescent Lakes - Premier Series and explore a gated community of single-family h
Key facts
- Gated community
- Walk-in closet
- Primary suite
Tags
Property features AI
Finance
- Financial info: Pets allowed
- HOA & community: Homeowners association with monthly fees; Association fees include irrigation water, grounds maintenance, street lights, and security; Community amenities: pool, clubhouse, cabana, dog park, playground, park, trails, sidewalks, picnic/barbecue areas, tennis courts, basketball court, pickleball, pier, restaurant, and management; Gated community
Exterior
- Parking: Attached 2-car garage; Driveway parking; Paved parking; Garage with opener; Electric vehicle charging station; Common parking areas; Two covered spaces
- Security: Gated community with security gate; Smoke detectors
- Utilities: Public water; Public sewer; Cable available
- Home design: Single-story home; New construction; Faces south; North exposure listed
- Construction: Block, concrete and stucco construction; Shingle roof
- Exterior features: Lanai; Patio; Porch; Screened patio/porch; Patio (listed separately); Community pool; Irrigation from lake; Rectangular lot; Paved road
Interior
- Kitchen: Dishwasher; Disposal; Microwave; Range; Refrigerator; Walk-in pantry; Eat-in kitchen
- Bedrooms: Screened porch listed as a room type
- Flooring: Carpet; Tile
- Bathrooms: 2 full bathrooms
- Heating & cooling: Central heating (electric); Central air conditioning (electric)
- Interior features: Double-hung windows with shutters; Dual sinks; Eat-in kitchen; Pantry; Separate shower (shower only); Walk-in closets
- Laundry & utility: Washer and dryer inside
Neighborhood map
What this means for you Summary
Snapshot
- This is a 3-bed/2.0-bath land listed at $275k.
Deal economics
- At list price, monthly cash flow is $-297 ($-4k/yr) — negative.
- To cash-flow at today's rent, offer at most $223k (19.1% below list).
- To meet the 1% rule (rent ≥ 1% of price), the offer needs to be $265k (3.5% below list).
- Recommended offer: $223k (19.1% below list) — sets the bar for cash-flow.
- Cap rate 5.0% vs local median 3.6% in North Fort Myers — top-decile yield for the area; either an underpriced asset or a hidden risk that comps aren't pricing in. Stress-test before assuming the spread holds.
Location & tenants
- Location reads 74/100 on livability (#269 in FL, #4,409 nationally) — a middle-class / working-renter tenant base. Strengths: cost of living A+, housing A+, health & safety A+; Watch: employment C-, amenities F, commute F.
- Charlotte (suburban): math 54% / reading 54% proficiency, ranked #22 of 73 in FL (top 30%) — acceptable for families but not a draw, mixed tenant base, ~2y average lease.
- Market conditions: Rents rising fast (+4.1%/yr); 1037 active listings in the ZIP; 40 comparable units currently listed for rent nearby; rentals at typical pace (median 21d on market — plan ~3-4 weeks tenant-placement turnaround); 4,585 units permitted in Charlotte County in 2024 (703 in 5+ unit buildings).
- This rent runs 44% of the median local income ($72k/yr) — at the standard rent-burdened threshold; future hikes will face affordability resistance.
Forward outlook
- Local home prices are declining (-3.0%/yr); year-one equity from $2k of loan paydown is wiped out by about $8k of value loss. Plan a longer hold.
- Charlotte County population projected at +24% by 2050 — long-run rental-demand tailwind backs the buy-and-hold thesis.
Negotiation context
- It's been on market 99 days — a 9% lower offer ($250k) is reasonable based on typical stale-listing flexibility.
- 6 sale attempts since 2y ago; this cycle's ask has dropped $15k (5%) from the opening price — seller is motivated, your offer sets the floor, not the list.
Questions for the listing agent
- What do current leases actually rent for vs. the listed asking? Can we see a recent rent roll and the last 12 months of T-12 income?
- It's been on market 99 days. Have you received any prior offers? Is the seller open to a 19% concession, seller financing, or rate buy-down credit?
- What does the HOA fee cover, when was the last increase, and are there any pending special assessments or reserve-fund shortfalls?
- Why hasn't it sold? Are there any deal-killer items the seller is aware of (foundation, flood, title, zoning, code violations)?
- Is there a deadline driving the sale (1031 exchange, divorce, estate, relocation)? That informs how much negotiation room exists.
- The area grade is low — what's the realistic commute time and amenity access for the typical tenant pool here? Any planned neighborhood developments (good or bad) we should know about?
- What's the average days-on-market for RENTAL listings here right now (not sales)? A rising rental-DOM trend means longer vacancies and softer asking-rent achievability than the comps imply.
- What's the recent tenant-quality profile in this submarket — average credit score on applications, eviction rate, late-payment / NSF rate, and stable-employment percentage? A property-management company in the area should have these aggregated.
- How much new for-sale + rental construction is in the pipeline within 1–3 miles? Heavy new supply typically softens prices + rents 12–24 months out; constrained supply supports both.
Investment metrics
- 1% rule
- 0.96% ✗
- Cap rate
- 5.00%
- Cash-on-cash
- -4.63%
- DSCR
- 0.79
- GRM
- 8.6
CMA / ARV
No comps found within radius.
Projected returns pro-forma
-3.0% appreciation · 4.13% rent growth · sell at horizon
- IRR
- -22.3%
- Equity multiple
- 0.22×
- Total profit
- $-60,089
- Equity at exit
- $41,003
- IRR
- -13.0%
- Equity multiple
- 0.19×
- Total profit
- $-62,486
- Equity at exit
- $23,777
Cash invested: $77,000 (down + closing). Projections, not guarantees.
Landlord ↔ Tenant lean methodology
- Overall (STATE)
- 87 Strongly Landlord-Friendly
- State Florida
- 87 Strongly Landlord-Friendly · R+3
- County
- — inherits STATE
- City
- — inherits STATE
ZIP-level market 33982
- Home prices YoY
- -1.2%
- Rents YoY
- 4.1%
- Active inventory
- 1037
- Price-to-rent
- 8.6×
Monthly cashflow live
- Estimated rent
- $2,653 medium interval (Pro) →
- Mortgage (P&I)
- −$1,442
- Tax from tax record
- −$500 /mo · $5,994/yr
- Insurance
- −$115
- HOA
- −$337
- Vacancy / Maint / Mgmt
- −$557
- Net cashflow
- $-297
Break-even live
UW: 25.0% down · 7.5% · 30yr · 1.5% tax · 5.0% vac · 8.0% maint · 8.0% mgmt
Financing live
Cash to close
- Down payment
- $68,750
- Closing costs
- $8,250
- Reserves months
- —
- Total cash needed
- —
Loan-product check · same deal, 3 products live
Conventional
25% down · 7.5% · 30yr
- Down + closing
- —
- Monthly P&I
- —
- Monthly cashflow
- —
- DSCR
- —
- Eligible?
- —
Personal DTI + credit; lowest rate.
DSCR
20% down · 8.5% · 30yr
- Down + closing
- —
- Monthly P&I
- —
- Monthly cashflow
- —
- DSCR
- —
- Eligible?
- —
No personal income docs; deal must DSCR.
Hard money
10% down · 12.0% · 12mo
- Down + closing
- —
- Monthly P&I
- —
- Monthly cashflow
- —
- DSCR
- —
- Eligible?
- —
Short-term bridge; refi at stabilization.
Rent comps 40 comps
| Address | Beds | Baths | Sqft | Rent | $/sqft | DOM | Units | Dist |
|---|---|---|---|---|---|---|---|---|
| 44458 Diamond Trl Punta Gorda, FL | 3.0 | 2.0 | 1484 | $2,500 | $1.68 | 21d | 1 | 0.26mi |
| 44229 Saddlewood Ct Punta Gorda, FL | 4.0 | 2.0 | 1675 | $2,350 | $1.40 | 13d | 1 | 0.37mi |
| 44229 Saddlewood Ct Punta Gorda, FL | 4.0 | 2.0 | 1675 | $2,395 | $1.43 | 21d | 1 | 0.37mi |
| 16922 Sage Ter Punta Gorda, FL | 4.0 | 2.0 | 1580 | $3,500 | $2.22 | 21d | 1 | 0.55mi |
| 43866 Blue Heron Ln Punta Gorda, FL | 2.0 | 2.0 | 1516 | $2,200 | $1.45 | 21d | 1 | 0.79mi |
| 15405 Green Acres Ave #2341 Punta Gorda, FL | 2.0 | 2.0 | 1154 | $5,500 | $4.77 | 21d | 1 | 0.91mi |
| 15405 Green Acres Ave #2331 Punta Gorda, FL | 3.0 | 2.0 | 1301 | $5,500 | $4.23 | 21d | 1 | 0.91mi |
| 15405 Green Acres Ave #2327 , FL | 2.0 | 2.0 | 1154 | $4,500 | $3.90 | 13d | 1 | 0.91mi |
| 15375 Green Acres Ave #2243 , FL | 2.0 | 2.0 | 1120 | $4,500 | $4.02 | 13d | 1 | 0.91mi |
| 15405 Green Acres Ave Unit 2322 Punta Gorda, FL | 2.0 | 2.0 | 1150 | $4,000 | $3.48 | 21d | 1 | 0.91mi |
| 43645 Sparrow Dr Punta Gorda, FL | 2.0 | 2.0 | 1503 | $6,500 | $4.32 | 13d | 1 | 0.97mi |
| 15345 Green Acres Ave #2111 Punta Gorda, FL | 3.0 | 2.0 | 1301 | $4,795 | $3.69 | 21d | 1 | 1.02mi |
| 15345 Green Acres Ave #2116 Punta Gorda, FL | 2.0 | 2.0 | 1154 | $1,900 | $1.65 | 21d | 1 | 1.02mi |
| 16000 Grassland Ln #3127 Punta Gorda, FL | 2.0 | 2.0 | 1355 | $6,000 | $4.43 | 21d | 1 | 1.02mi |
| 15375 Green Acres Ave #2211 Punta Gorda, FL | 3.0 | 2.0 | 1301 | $2,295 | $1.76 | 21d | 1 | 1.03mi |
| 15345 Green Acres Ave Unit 2117 Punta Gorda, FL | 2.0 | 2.0 | 1154 | $6,000 | $5.20 | 21d | 1 | 1.03mi |
| 15285 Green Acres AVE #415 Punta Gorda, FL | 2.0 | 2.0 | 1120 | $1,800 | $1.61 | 21d | 1 | 1.06mi |
| 15285 Green Acres Ave Unit 425 Punta Gorda, FL | 2.0 | 2.0 | 1120 | $4,950 | $4.42 | 13d | 1 | 1.06mi |
| 15285 Green Acres Ave Unit 425 Punta Gorda, FL | 2.0 | 2.0 | 1120 | $4,950 | $4.42 | 21d | 1 | 1.06mi |
| 15285 Green Acres AVE #414 Punta Gorda, FL | 2.0 | 2.0 | 1120 | $6,000 | $5.36 | 21d | 1 | 1.10mi |
| 15275 Green Acres Ave #338 Punta Gorda, FL | 3.0 | 2.0 | 1301 | $4,795 | $3.69 | 21d | 1 | 1.11mi |
| 15275 Green Acres Ave #324 Punta Gorda, FL | 2.0 | 2.0 | 1120 | $1,600 | $1.43 | 21d | 1 | 1.11mi |
| 15275 Green Acres Ave #344 Punta Gorda, FL | 2.0 | 2.0 | 1120 | $5,500 | $4.91 | 21d | 1 | 1.11mi |
| 15275 Green Acres Ave #337 Punta Gorda, FL | 2.0 | 2.0 | 1154 | $1,900 | $1.65 | 21d | 1 | 1.11mi |
| 15275 Green Acres Ave #323 Punta Gorda, FL | 2.0 | 2.0 | 1154 | $5,000 | $4.33 | 21d | 1 | 1.11mi |
| 15275 Green Acres Ave #335 Punta Gorda, FL | 2.0 | 2.0 | 1120 | $4,000 | $3.57 | 21d | 1 | 1.11mi |
| 15943 Grassland Ln #3912 Punta Gorda, FL | 3.0 | 2.0 | 1741 | $8,800 | $5.05 | 21d | 1 | 1.12mi |
| 17710 Shade Tree Loop Punta Gorda, FL | 4.0 | 2.0 | 1764 | $3,000 | $1.70 | 21d | 1 | 1.14mi |
| 15265 Green Acres Ave Unit 228 Punta Gorda, FL | 2.0 | 2.0 | 1569 | $5,000 | $3.19 | 21d | 1 | 1.16mi |
| 15265 Green Acres Ave Unit 228 Punta Gorda, FL | 2.0 | 2.0 | 1569 | $5,500 | $3.51 | 13d | 1 | 1.16mi |
| 15960 Grassland Ln #2714 Punta Gorda, FL | 2.0 | 2.0 | 1366 | $2,800 | $2.05 | 21d | 1 | 1.17mi |
| 15960 Grassland Ln #2727 Punta Gorda, FL | 2.0 | 2.0 | 1422 | $6,000 | $4.22 | 21d | 1 | 1.17mi |
| 15960 Grassland Ln #2721 Punta Gorda, FL | 2.0 | 2.0 | 1569 | $5,500 | $3.51 | 21d | 1 | 1.17mi |
| 15960 Grassland Ln #2713 Punta Gorda, FL | 2.0 | 2.0 | 1569 | $7,500 | $4.78 | 21d | 1 | 1.17mi |
| 15919 Grassland Ln #4211 Punta Gorda, FL | 3.0 | 2.0 | 1741 | $8,800 | $5.05 | 21d | 1 | 1.18mi |
| 43051 Greenway Blvd #822 Punta Gorda, FL | 2.0 | 2.0 | 1355 | $7,500 | $5.54 | 21d | 1 | 1.18mi |
| 43060 Greenway Blvd #731 Punta Gorda, FL | 2.0 | 2.0 | 1301 | $6,500 | $5.00 | 21d | 1 | 1.19mi |
| 43060 Greenway Blvd #713 Punta Gorda, FL | 2.0 | 2.0 | 1150 | $5,400 | $4.70 | 21d | 1 | 1.19mi |
| 43060 Greenway Blvd #742 Punta Gorda, FL | 2.0 | 2.0 | 1154 | $6,000 | $5.20 | 21d | 1 | 1.19mi |
| 43041 Greenway Blvd Punta Gorda, FL | 2.0–3.0 | 2.0 | 1569 | $7,500 | $4.78 | 21d | 3 | 1.21mi |
HOA detail
- Monthly dues
- $337 · $4,044/yr
- Likely covers
- security
Listing history 25 events
-
2026-05-22status Pending
-
2026-03-16price $274,999
-
2026-02-12$289,999 Active
-
2026-02-06historical
-
2026-02-05$287,580 Active
-
2026-01-02historical
-
2025-10-17$289,999 Active
-
2025-10-15historical
-
2025-10-15historical
-
2025-09-23price $289,999
-
2025-09-23price $289,999
-
2025-09-19$304,580 Active
-
2025-08-26price $304,580
-
2025-06-05price $287,580
-
2025-05-28status Active
-
2025-05-22status Pending
-
2025-03-03price $289,580
-
2025-01-29price $299,580
-
2025-01-03price $309,580
-
2024-12-13price $301,580
-
2024-12-09price $299,015
-
2024-11-07price $294,015
-
2024-11-04price $304,015
-
2024-10-23price $299,015
-
2024-09-27$300,015 Active
ⓘ Source: listings_history table (triggers on properties + properties_extension) + one-shot
backfill from property_details.listing_events for pre-trigger history.
Tax reassessment forecast FL · Resets to sale price
- Current annual tax
- $5,994 · $500/mo
- Projected year-2 tax
- $5,994 · $500/mo
- Expected delta
- $0/yr ($0/mo · 0.0%)
ⓘ Screening estimate from a state-policy table — verify with the county assessor before closing.
Nearby sold comps map
Loading sold comps map…
Walkable amenities ~0.75 mi
Loading nearby amenities…
Taxation est. · year 1
- Rental income
- $31,840
- − Mortgage interest
- −$15,404
- − Property taxes
- −$5,994
- − Insurance
- −$1,375
- − Repairs & maintenance
- −$2,547
- − Management
- −$2,547
- − HOA
- −$4,044
- − Depreciation
- −$8,000
- Taxable loss
- −$8,072
- Est. tax savings @ 24.0%
- +$1,937
- After-tax cash flow
- $-1,628/yr
For passive investors: Depreciation is non-cash, so a rental often shows a tax loss while cash-flowing — sheltering income. Rental losses are passive: they offset passive income freely, and up to $25,000/yr can offset ordinary (W-2) income if you actively participate and your MAGI is under $100k (phasing out to $0 by $150k); unused losses carry forward. On sale, claimed depreciation is recaptured at up to 25%, and gains may owe capital-gains tax (a 1031 exchange can defer both). Figures are a year-1 estimate at your 24.0% rate — not tax advice; consult a CPA.
Schools (NCES district)
- District
- Charlotte
- NCES district ID
- 1200240
- Math proficiency
- 54% ▼ -6.00%
- Reading proficiency
- 54% ▼ -1.00%
- Median HH income
- $44,864
- Composite
- 45.62/100
- National rank
- #2586
- State rank
- #22 of 73 in FL
Livability — North Fort Myers
- Score
- 74/100
- State rank
- #269
- US rank
- #4409
Category grades
Schools grade is shown separately in the Schools card above.
Census & demographics
- County
- Charlotte County · 196,994 people
- City population
- 57,035
- Metro
- Punta Gorda, FL
- Population (ZIP)
- 13,006
- Household income
- $72,443
- Rent vs Own
- Severe rent burden
- 43.0
Population outlook (Charlotte County) Hauer SSP2
- Today (2025)
- 198,646 people
- By 2030
- 210,507 · +6.0%
- By 2040
- 230,857 · +16.2%
- By 2050
- 247,148 · +24.4%
- By 2075
- 281,777 · +41.8%
- By 2100
- 293,609 · +47.8%
Race, ethnicity, and origin ACS 2023
- Neighborhood character
- Predominantly White (81%)
- Race & ethnicity
- White 81% Two or more races 8% Hispanic / Latino 7% Black 7%
- Hispanic origin (detail)
- Puerto Rican 2% Cuban 3%
- Common ancestry
- Lithuanian 3% Iranian 3% Slovak 3%
- Foreign-born
- 6% · Canada, Jamaica
- Languages at home
- 93% English-only · Spanish 5% German/W. Germanic 1% Arabic 1%
Political lean MEDSL · Charlotte
- 2024 margin
- Solid R (+34.0) · D 32.7% · R 66.7%
- 2008→2024 swing
- -26.7pp toward R · 2008: -7.2pp · 2024: -34.0pp
- All cycles
- 2024: R+34.0 2020: R+26.6 2016: R+27.8 2012: R+14.3 2008: R+7.2
Not yet ingested
- Civics
- —
Market trends
- HPI YoY
- ▼ -5.25%
- Current HPI
- 448.5895
- Rent YoY
- ▲ 4.13%
- Metro
- Punta Gorda, FL
- State GDP YoY
- ▲ 3.28%
- F500 in state
- 36
Industry mix (Fortune 500 HQ in FL)
| Industry | F500 HQs | Revenue |
|---|---|---|
| Industrial Technology | 2 | $29B |
|
||
| Insurance | 2 | $17B |
|
||
| Retail | 1 | $60B |
|
||
| Technology Distribution | 1 | $58B |
|
||
| Homebuilding | 1 | $35B |
|
||
| Technology Manufacturing | 1 | $35B |
|
||
Price history
-8.3% since first listed25 events — show timeline
- 2026-05-22 Pending — FORTMLS
- 2026-03-16 Price Changed $274,999 FORTMLS
- 2026-02-12 Listed $289,999 FORTMLS
- 2026-02-06 Listing Removed — FORTMLS
- 2026-02-05 Listed $287,580 FORTMLS
- 2026-01-02 Listing Removed — FORTMLS
- 2025-10-17 Listed $289,999 FORTMLS
- 2025-10-15 Listing Removed — Stellar MLS as Distributed by MLS Grid
- 2025-10-15 Listing Removed — FORTMLS
- 2025-09-23 Price Changed $289,999 FORTMLS
- 2025-09-23 Price Changed $289,999 Stellar MLS as Distributed by MLS Grid
- 2025-09-19 Listed $304,580 Stellar MLS as Distributed by MLS Grid
- 2025-08-26 Price Changed $304,580 FORTMLS
- 2025-06-05 Price Changed $287,580 FORTMLS
- 2025-05-28 Relisted — FORTMLS
- 2025-05-22 Pending — FORTMLS
- 2025-03-03 Price Changed $289,580 FORTMLS
- 2025-01-29 Price Changed $299,580 FORTMLS
- 2025-01-03 Price Changed $309,580 FORTMLS
- 2024-12-13 Price Changed $301,580 FORTMLS
- 2024-12-09 Price Changed $299,015 FORTMLS
- 2024-11-07 Price Changed $294,015 FORTMLS
- 2024-11-04 Price Changed $304,015 FORTMLS
- 2024-10-23 Price Changed $299,015 FORTMLS
- 2024-09-27 Listed $300,015 FORTMLS
Property tax history
+105.5%/yrLatest (2025): $5,994 · +105.5% YoY. Source: county tax records.
Cash-flow waterfall
monthlySold comps — $/sqft
last 12 mo · ≤1 miLoading sold comps…