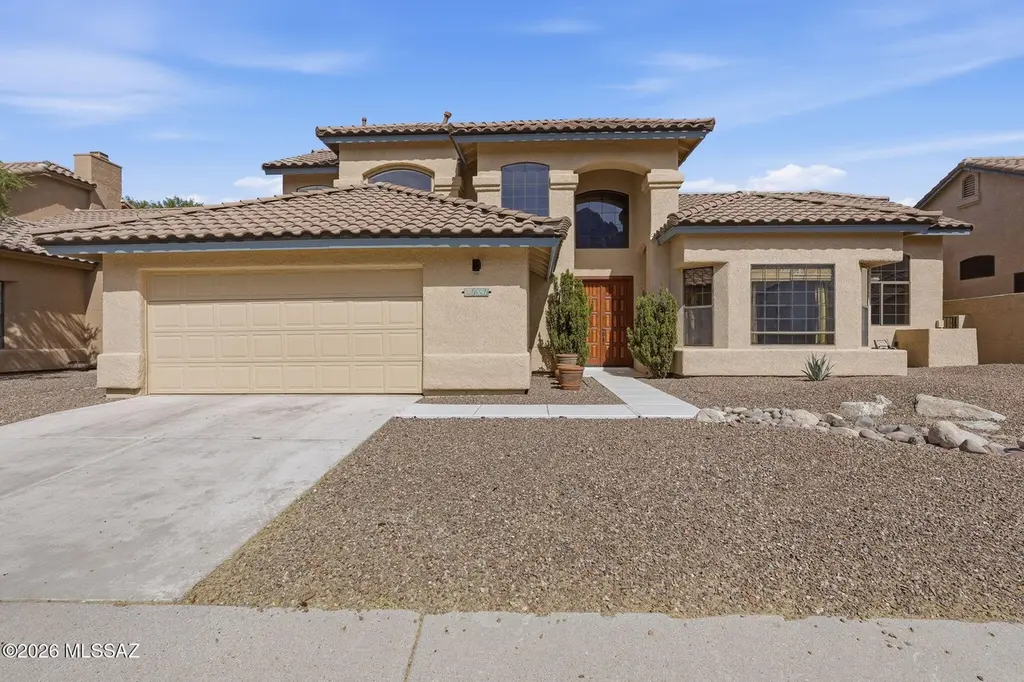
1391 E Sonoran Desert Dr
Oro Valley, AZ 85737
$449,000D+
3 bd · 3.0 ba ·
2,595 sqft ·
Built 1994
· SingleFamily
· Active
· 65 DOM
Cashflow @ list (25.0% down · 7.5%)
Estimated rent
$3,891/mo
Mortgage (P&I)
−$2,355
Tax + insurance
−$626
HOA
−$70
Vac / Maint / Mgmt
−$817
Net cashflow
$23/mo
Annual
$281/yr
Cap rate
6.53%
Cash-on-cash
0.86%
DSCR
1.04
1% rule
0.87%
Cash to close
$125,720
Investor read
- This is a 3-bed/3.0-bath single-family listed at $449k.
- At list price, monthly cash flow is $23 ($281/yr) — positive.
- The deal already cash-flows at list — no discount required.
- To meet the 1% rule (rent ≥ 1% of price), the offer needs to be $389k (13.3% below list).
- It's been on market 65 days — a 6% lower offer ($422k) is reasonable based on typical stale-listing flexibility.
- Recommended offer: $389k (13.3% below list) — sets the bar for 1% rule.
- Local home prices are declining (-3.0%/yr); year-one equity from $3k of loan paydown is wiped out by about $13k of value loss. Plan a longer hold.
- Location reads 81/100 on livability (#2 in AZ, #1,339 nationally) — a professional / high-income tenant draw. Strengths: crime A+, employment A+, housing A+; Watch: commute D, amenities F, cost of living D-.
- Amphitheater Unified District (4406) (suburban): math 32% / reading 40% proficiency, ranked #85 of 249 in AZ (top 34%) — families likely to look elsewhere, expect single-tenant / working-renter base with shorter leases.
- Watch-outs: flood insurance adds $66/mo.
- Market conditions: Rents rising (+2.7%/yr); 163 active listings in the ZIP; 10 comparable units currently listed for rent nearby; rentals at typical pace (median 25d on market — plan ~3-4 weeks tenant-placement turnaround); 40% of comp listings sitting > 30 days — soft ceiling on asking rent; solid renter incomes; 5,268 units permitted in Pima County in 2024 (996 in 5+ unit buildings).
- Pima County population projected at +8% by 2050 — modest demand growth; plan on rents tracking national, not racing it.
- 11 sale attempts since 33y ago; this cycle's ask has dropped $150k (25%) from the opening price — seller is motivated, your offer sets the floor, not the list.
- Current owner paid $214k; list at $449k implies a 110% gain — meaningful room to come down on a strong offer.
- Climate carrying-cost: severe flood risk; major wildfire risk; extreme-heat days projected 8→23/yr by 2055 (HVAC capex compounding) — expect insurance premiums to compound above CPI over the hold.
- Cap rate 6.5% vs local median 3.2% in Oro Valley — top-decile yield for the area; either an underpriced asset or a hidden risk that comps aren't pricing in. Stress-test before assuming the spread holds.
- This rent runs 43% of the median local income ($107k/yr) — at the standard rent-burdened threshold; future hikes will face affordability resistance.
Questions for listing agent
- It's been on market 65 days. Have you received any prior offers? Is the seller open to a 13% concession, seller financing, or rate buy-down credit?
- What's the actual annual flood-insurance premium (NFIP or private), and is the property in a SFHA with mandatory coverage?
- What does the HOA fee cover, when was the last increase, and are there any pending special assessments or reserve-fund shortfalls?
- Why hasn't it sold? Are there any deal-killer items the seller is aware of (foundation, flood, title, zoning, code violations)?
- Is there a deadline driving the sale (1031 exchange, divorce, estate, relocation)? That informs how much negotiation room exists.
- Schools are A-rated — typically a magnet for longer-tenancy family renters. What's the average tenant stay here, and is there a school-zone premium baked into asking?
- The area grade is low — what's the realistic commute time and amenity access for the typical tenant pool here? Any planned neighborhood developments (good or bad) we should know about?
- What's the average days-on-market for RENTAL listings here right now (not sales)? A rising rental-DOM trend means longer vacancies and softer asking-rent achievability than the comps imply.
CashFlowRE · CFR-ATNHME514RPTGW
· Data 3 days ago
cashflowre.app · 2026-05-29