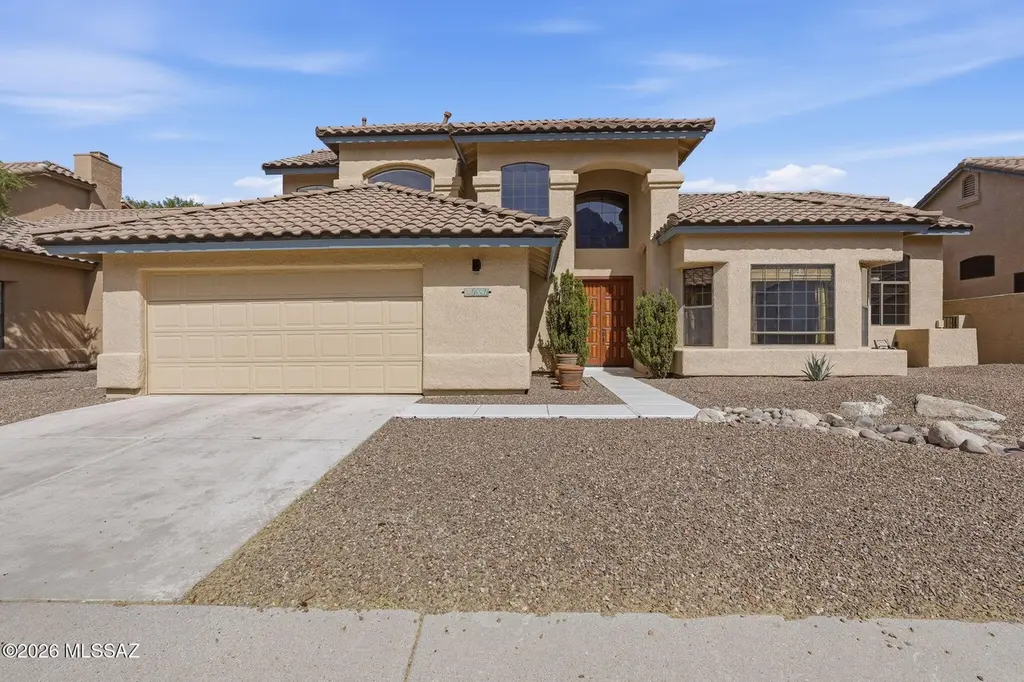
1391 E Sonoran Desert Dr · Oro Valley, AZ
Flood risk 8/10 · Major
- FEMA flood zone
- X (unshaded)
- Chance of flooding over 30 yrs
- 0.99%
- Est. flood insurance / yr
- $507 – $1,088
Fire risk 6/10 · Moderate
- Est. fire insurance / yr
- $610 – $1,132
Heat risk 8/10 · Major
- Hot days now (above 101°F)
- 8 days/yr
- Hot days in 30 yrs
- 23 days/yr
Wind risk 1/10 · Minimal
- Chance of severe wind over 30 yrs
- —
Air-quality risk 1/10 · Minimal
- Unhealthy air days now
- 0 days/yr
- Unhealthy air days in 30 yrs
- 0 days/yr
Risk factors via First Street. Map © Google.
Why this score? — see what drove the D+ grade
The composite is a weighted blend of 9 inputs, each scored 0–100. Each bar is that input's sub-score; the figure is the points it added to the 100-point composite (weight × sub-score).
- Cash flow +14.4/30.0
- ARV discount +14.4/15.0
- DSCR +4.4/10.0
- Livability +4.0/5.0
- 1% rule +3.7/10.0
- Rent growth +3.2/5.0
- Schools +3.1/10.0
- Condition / age +2.5/5.0
- Appreciation +0.0/10.0
$449,000
🖨 Deal sheet (PDF) 📄 Offer letter ✓ Due diligence
Listing remarks MLS
Set within the gated enclave of La Reserve, this three bedroom, two bathroom residence blends architectural character with effortless style. Inside, soaring cathedral ceilings and a custom see through fireplace anchor the grand living and great room spaces, each distinguished by its own artisan hearth, one crafted in hand laid stone and the other in Italian marble. The first floor showcases stunning travertine flooring, an elegant formal dining area, and a spacious great room designed for both comfort and sophistication. The gourmet kitchen is a dream for the culinary enthusiast, appointed with the highest-grade granite countertops, custom Alderwood cabinetry with crown molding, deep drawer storage, and Viking Professional appliances including a warming drawer. Above it all, a loft floa over the great room, adding versatility and architectural drama. The primary suite offers a retreat level experience with a soaking tub, double vanity, walk in shower, and a large walk in closet. Outdoors, sculpted desert landscaping, a tranquil front fountain, and an expansive covered patio frame the mountain backdrop, creating a serene and elevated living experience in one of Oro Valley's most prestigious gated communities.
Key facts
- Gated enclave
- Cathedral ceilings
- Italian marble
Tags
Neighborhood map
What this means for you Summary
Snapshot
- This is a 3-bed/3.0-bath single-family listed at $449k.
Deal economics
- At list price, monthly cash flow is $23 ($281/yr) — positive.
- The deal already cash-flows at list — no discount required.
- To meet the 1% rule (rent ≥ 1% of price), the offer needs to be $389k (13.3% below list).
- Recommended offer: $389k (13.3% below list) — sets the bar for 1% rule.
- Cap rate 6.5% vs local median 3.2% in Oro Valley — top-decile yield for the area; either an underpriced asset or a hidden risk that comps aren't pricing in. Stress-test before assuming the spread holds.
Location & tenants
- Location reads 81/100 on livability (#2 in AZ, #1,339 nationally) — a professional / high-income tenant draw. Strengths: crime A+, employment A+, housing A+; Watch: commute D, amenities F, cost of living D-.
- Amphitheater Unified District (4406) (suburban): math 32% / reading 40% proficiency, ranked #85 of 249 in AZ (top 34%) — families likely to look elsewhere, expect single-tenant / working-renter base with shorter leases.
- Market conditions: Rents rising (+2.7%/yr); 163 active listings in the ZIP; 10 comparable units currently listed for rent nearby; rentals at typical pace (median 24d on market — plan ~3-4 weeks tenant-placement turnaround); 40% of comp listings sitting > 30 days — soft ceiling on asking rent; solid renter incomes; 5,268 units permitted in Pima County in 2024 (996 in 5+ unit buildings).
- This rent runs 43% of the median local income ($107k/yr) — at the standard rent-burdened threshold; future hikes will face affordability resistance.
Forward outlook
- Local home prices are declining (-3.0%/yr); year-one equity from $3k of loan paydown is wiped out by about $13k of value loss. Plan a longer hold.
- Pima County population projected at +8% by 2050 — modest demand growth; plan on rents tracking national, not racing it.
Negotiation context
- It's been on market 65 days — a 6% lower offer ($422k) is reasonable based on typical stale-listing flexibility.
- 11 sale attempts since 33y ago; this cycle's ask has dropped $150k (25%) from the opening price — seller is motivated, your offer sets the floor, not the list.
- Current owner paid $214k; list at $449k implies a 110% gain — meaningful room to come down on a strong offer.
Risks & watch-outs
- Watch-outs: flood insurance adds $66/mo.
- Climate carrying-cost: severe flood risk; major wildfire risk; extreme-heat days projected 8→23/yr by 2055 (HVAC capex compounding) — expect insurance premiums to compound above CPI over the hold.
Questions for the listing agent
- It's been on market 65 days. Have you received any prior offers? Is the seller open to a 13% concession, seller financing, or rate buy-down credit?
- What's the actual annual flood-insurance premium (NFIP or private), and is the property in a SFHA with mandatory coverage?
- What does the HOA fee cover, when was the last increase, and are there any pending special assessments or reserve-fund shortfalls?
- Why hasn't it sold? Are there any deal-killer items the seller is aware of (foundation, flood, title, zoning, code violations)?
- Is there a deadline driving the sale (1031 exchange, divorce, estate, relocation)? That informs how much negotiation room exists.
- Schools are A-rated — typically a magnet for longer-tenancy family renters. What's the average tenant stay here, and is there a school-zone premium baked into asking?
- The area grade is low — what's the realistic commute time and amenity access for the typical tenant pool here? Any planned neighborhood developments (good or bad) we should know about?
- What's the average days-on-market for RENTAL listings here right now (not sales)? A rising rental-DOM trend means longer vacancies and softer asking-rent achievability than the comps imply.
- What's the recent tenant-quality profile in this submarket — average credit score on applications, eviction rate, late-payment / NSF rate, and stable-employment percentage? A property-management company in the area should have these aggregated.
- How much new for-sale + rental construction is in the pipeline within 1–3 miles? Heavy new supply typically softens prices + rents 12–24 months out; constrained supply supports both.
Investment metrics
- 1% rule
- 0.87% ✗
- Cap rate
- 6.53%
- Cash-on-cash
- 0.86%
- DSCR
- 1.04
- GRM
- 9.6
CMA / ARV
- ARV (median comp)
- $530,371
- List price
- $449,000
- Delta
- -15.34%
- Verdict
- UNDERPRICED
- Comps
- 20 within 1.0 mi
Show comp detail 12 sales within ~0.75 mi
| Address | Dist | Beds/Ba | Sqft | Sold | Price | $/sf | Match |
|---|---|---|---|---|---|---|---|
| 1705 E Deer Shadow Ln | 0.31mi | 4/3.0 (+1) | 2,499 (-4%) | 6mo | $480,000 | $192 | 69 |
| 10269 N Calle Del Carnero | 0.40mi | 4/2.5 (+1) | 2,505 (-4%) | 2mo | $615,000 | $246 | 67 |
| 10290 N Carristo Dr | 0.36mi | 3/2.5 | 2,346 (-10%) | 2mo | $840,418 | $358 | 63 |
| 10285 N Carristo Dr | 0.36mi | 3/2.5 | 2,309 (-11%) | 1mo | $560,000 | $243 | 62 |
| 10318 N Alder Spring Dr | 0.31mi | 3/3.0 | 2,292 (-12%) | 6mo | $584,325 | $255 | 61 |
| 1798 E Placita Del Metate | 0.31mi | 3/2.5 | 2,858 (+10%) | 10mo | $724,000 | $253 | 58 |
| 1250 E El Conquistador Way | 0.74mi | 3/3.0 | 2,470 (-5%) | 1mo | $970,000 | $393 | 56 |
| 10265 N Carristo Dr | 0.39mi | 3/3.0 | 2,292 (-12%) | 8mo | $815,000 | $356 | 56 |
| 10053 N Alder Spring Dr | 0.68mi | 3/2.5 | 2,407 (-7%) | 2mo | $599,000 | $249 | 53 |
| 10195 N Alder Spring Dr | 0.49mi | 3/2.5 | 2,349 (-10%) | 10mo | $640,000 | $272 | 51 |
| 1822 E Pusch Wilderness Dr | 0.38mi | 4/2.0 (+1) | 2,350 (-9%) | 10mo | $570,000 | $243 | 49 |
| 10231 N Cliff Dweller Pl | 0.54mi | 3/3.0 | 2,958 (+14%) | 16mo | $1,100,000 | $372 | 39 |
Match score weights: distance 35% · size 25% · config 20% · recency 20%. Top-matched comps best support the ARV.
Projected returns pro-forma
-3.0% appreciation · 2.7% rent growth · sell at horizon
- IRR
- -16.3%
- Equity multiple
- 0.42×
- Total profit
- $-72,410
- Equity at exit
- $66,947
- IRR
- -8.5%
- Equity multiple
- 0.48×
- Total profit
- $-65,802
- Equity at exit
- $38,821
Cash invested: $125,720 (down + closing). Projections, not guarantees.
Landlord ↔ Tenant lean methodology
- Overall (STATE)
- 87 Strongly Landlord-Friendly
- State Arizona
- 87 Strongly Landlord-Friendly · R+3
- County
- — inherits STATE
- City
- — inherits STATE
ZIP-level market 85737
- Home prices YoY
- -19.6%
- Rents YoY
- 2.7%
- Active inventory
- 163
- Price-to-rent
- 9.6×
Monthly cashflow live
- Estimated rent
- $3,891 high interval (Pro) →
- Mortgage (P&I)
- −$2,355
- Tax from tax record
- −$372 /mo · $4,464/yr
- Insurance
- −$187
- Flood insurance flood zone
- −$66 /mo · $798/yr
- HOA
- −$70
- Vacancy / Maint / Mgmt
- −$817
- Net cashflow
- $23
Break-even live
Sensitivity live
| Price | -10% $278 | -5% $151 | +0% $23 | +5% $-104 | +10% $-231 |
|---|---|---|---|---|---|
| Rent | -10% $-284 | -5% $-130 | +0% $23 | +5% $177 | +10% $331 |
| Rate | -1.0pp $250 | -0.5pp $138 | base $23 | +0.5pp $-93 | +1.0pp $-211 |
UW: 25.0% down · 7.5% · 30yr · 1.5% tax · 5.0% vac · 8.0% maint · 8.0% mgmt
Financing live
Cash to close
- Down payment
- $112,250
- Closing costs
- $13,470
- Reserves months
- —
- Total cash needed
- —
Loan-product check · same deal, 3 products live
Conventional
25% down · 7.5% · 30yr
- Down + closing
- —
- Monthly P&I
- —
- Monthly cashflow
- —
- DSCR
- —
- Eligible?
- —
Personal DTI + credit; lowest rate.
DSCR
20% down · 8.5% · 30yr
- Down + closing
- —
- Monthly P&I
- —
- Monthly cashflow
- —
- DSCR
- —
- Eligible?
- —
No personal income docs; deal must DSCR.
Hard money
10% down · 12.0% · 12mo
- Down + closing
- —
- Monthly P&I
- —
- Monthly cashflow
- —
- DSCR
- —
- Eligible?
- —
Short-term bridge; refi at stabilization.
Rent comps 10 comps
| Address | Beds | Baths | Sqft | Rent | $/sqft | DOM | Units | Dist |
|---|---|---|---|---|---|---|---|---|
| 1184 Camino Diestro Unit 11 Oro Valley, AZ | 2.0 | 2.0 | 1851 | $4,500 | $2.43 | 24d | 1 | 0.53mi |
| 1184 Camino Diestro Oro Valley, AZ | 2.0 | 2.5 | 1851 | $4,500 | $2.43 | 44d | 1 | 0.53mi |
| 836 Camino Diestro Oro Valley, AZ | 2.0 | 2.5 | 1851 | $3,400 | $1.84 | 17d | 1 | 0.63mi |
| 836 Camino Diestro Unit none Oro Valley, AZ | 2.0 | 2.0 | 1851 | $3,400 | $1.84 | 17d | 1 | 0.63mi |
| 9876 N Ridge Shadow Pl Tucson, AZ | 2.0 | 2.5 | 2119 | $3,495 | $1.65 | 44d | 1 | 0.87mi |
| 293 E Jasper Ct Oro Valley, AZ | 3.0 | 2.5 | 2250 | $2,950 | $1.31 | 3d | 1 | 0.92mi |
| 2221 E Stone Stable Dr Tucson, AZ | 3.0 | 2.0 | 1759 | $3,500 | $1.99 | 24d | 1 | 1.03mi |
| 2227 E Stone Stable Dr Tucson, AZ | 4.0 | 2.0 | 1759 | $3,500 | $1.99 | 24d | 1 | 1.03mi |
| 272 E Southern Pines Dr Tucson, AZ | 2.0 | 2.0 | 1811 | $3,800 | $2.10 | 44d | 1 | 1.06mi |
| 11096 N Pusch Ridge View Pl Tucson, AZ | 4.0 | 3.0 | 3420 | $12,000 | $3.51 | 44d | 1 | 1.16mi |
HOA detail
- Monthly dues
- $70 · $840/yr
- Likely covers
- landscapingsecurity
Listing history 41 events
-
2026-06-18days on market $449,000 Active 65 DOM
-
2026-06-17days on market $449,000 Active 64 DOM
-
2026-06-16days on market $449,000 Active 63 DOM
-
2026-06-15days on market $449,000 Active 62 DOM
-
2026-06-13days on market $449,000 Active 60 DOM
-
2026-06-10days on market $449,000 Active 57 DOM
-
2026-06-09days on market $449,000 Active 56 DOM
-
2026-06-08days on market $449,000 Active 55 DOM
-
2026-06-07pricedays on market $449,000 Active 54 DOM
-
2026-06-05days on market $599,000 Active 51 DOM
-
2026-06-03days on market $599,000 Active 50 DOM
-
2026-06-02days on market $599,000 Active 49 DOM
-
2026-06-01days on market $599,000 Active 48 DOM
-
2026-05-31days on market $599,000 Active 47 DOM
-
2026-04-14$599,000 Active 1231-char remark
Show marketing remark (1231 chars)
Set within the gated enclave of La Reserve, this three bedroom, two bathroom residence blends architectural character with effortless style. Inside, soaring cathedral ceilings and a custom see through fireplace anchor the grand living and great room spaces, each distinguished by its own artisan hearth, one crafted in hand laid stone and the other in Italian marble. The first floor showcases stunning travertine flooring, an elegant formal dining area, and a spacious great room designed for both comfort and sophistication. The gourmet kitchen is a dream for the culinary enthusiast, appointed with the highest-grade granite countertops, custom Alderwood cabinetry with crown molding, deep drawer storage, and Viking Professional appliances including a warming drawer. Above it all, a loft floa over the great room, adding versatility and architectural drama. The primary suite offers a retreat level experience with a soaking tub, double vanity, walk in shower, and a large walk in closet. Outdoors, sculpted desert landscaping, a tranquil front fountain, and an expansive covered patio frame the mountain backdrop, creating a serene and elevated living experience in one of Oro Valley's most prestigious gated communities.
-
2026-03-15historical
-
2025-11-22status Active
-
2025-11-19historical Active Contingent
-
2025-10-29status Active
-
2025-10-15historical
-
2025-10-01price $579,900
-
2025-08-03$589,900 Active
-
2004-03-19soldstatus $214,000
-
2003-12-26$229,900
-
2003-12-24historical
-
2003-11-27$239,500
-
2003-10-24historical
-
2003-06-17$225,000
-
2002-11-07soldstatus $245,000
-
1999-09-30historical
-
1999-08-26soldstatus $181,000
-
1999-08-25soldstatus $220,000
-
1999-08-23soldstatus $178,618
-
1999-01-29$257,500
-
1998-10-05$220,000
-
1998-09-15historical
-
1998-07-02$225,000
-
1994-07-01soldstatus $176,200
-
1994-07-01soldstatus $177,625
-
1993-12-17$176,200
-
1991-11-12soldstatus $82,000
ⓘ Source: listings_history table (triggers on properties + properties_extension) + one-shot
backfill from property_details.listing_events for pre-trigger history.
Tax reassessment forecast AZ · Resets to sale price
- Current annual tax
- $4,464 · $372/mo
- Projected year-2 tax
- $4,464 · $372/mo
- Expected delta
- $0/yr ($0/mo · 0.0%)
ⓘ Screening estimate from a state-policy table — verify with the county assessor before closing.
Climate risk First Street
- Flood 8/10 Severe FEMA zone X (unshaded) · 99% chance over 30 yrs
- Wildfire 6/10 Major
- Heat 8/10 Severe 8 d/yr ≥101°F today · 23 d/yr by 30 yrs out
- Wind 1/10 Low
- Air quality 1/10 Low 0 unhealthy d/yr today · 0 by 30 yrs out
Nearby sold comps map
Loading sold comps map…
Walkable amenities ~0.75 mi
Loading nearby amenities…
Taxation est. · year 1
- Rental income
- $46,688
- − Mortgage interest
- −$25,151
- − Property taxes
- −$4,464
- − Insurance
- −$3,042
- − Repairs & maintenance
- −$3,735
- − Management
- −$3,735
- − HOA
- −$840
- − Depreciation
- −$13,062
- Taxable loss
- −$7,342
- Est. tax savings @ 24.0%
- +$1,762
- After-tax cash flow
- $2,043/yr
For passive investors: Depreciation is non-cash, so a rental often shows a tax loss while cash-flowing — sheltering income. Rental losses are passive: they offset passive income freely, and up to $25,000/yr can offset ordinary (W-2) income if you actively participate and your MAGI is under $100k (phasing out to $0 by $150k); unused losses carry forward. On sale, claimed depreciation is recaptured at up to 25%, and gains may owe capital-gains tax (a 1031 exchange can defer both). Figures are a year-1 estimate at your 24.0% rate — not tax advice; consult a CPA.
Schools (NCES district)
- District
- Amphitheater Unified District (4406)
- NCES district ID
- 0400680
- Math proficiency
- 32% ▼ -13.00%
- Reading proficiency
- 40% ▼ -8.00%
- Median HH income
- $46,524
- Composite
- 30.82/100
- National rank
- #6135
- State rank
- #85 of 249 in AZ
Livability — Oro Valley
- Score
- 81/100
- State rank
- #2
- US rank
- #1339
Category grades
Schools grade is shown separately in the Schools card above.
Census & demographics
- Census place
- Oro Valley, AZ
- County
- Pima County · 1,012,107 people
- City population
- 41,345
- Metro
- Tucson, AZ
- Population (ZIP)
- 22,785
- Household income
- $107,348
- Rent vs Own
- Severe rent burden
- 666.0
Population outlook (Pima County) Hauer SSP2
- Today (2025)
- 1,066,056 people
- By 2030
- 1,086,684 · +1.9%
- By 2040
- 1,117,160 · +4.8%
- By 2050
- 1,149,778 · +7.9%
- By 2075
- 1,271,480 · +19.3%
- By 2100
- 1,321,160 · +23.9%
Race, ethnicity, and origin ACS 2023
- Neighborhood character
- Predominantly White (73%)
- Race & ethnicity
- White 73% Hispanic / Latino 19% Two or more races 12% Asian 3% Black 1%
- Hispanic origin (detail)
- Mexican 15%
- Common ancestry
- Romanian 4% Lithuanian 3% Italian 3%
- Foreign-born
- 11% · Canada, China
- Languages at home
- 85% English-only · Spanish 10% Other Indo-European 2% Chinese 1%
Political lean MEDSL · Pima
- 2024 margin
- D (+15.2) · D 57.0% · R 41.8% · Other 1.2%
- 2008→2024 swing
- +9.1pp toward D · 2008: 6.1pp · 2024: 15.2pp
- All cycles
- 2024: D+15.2 2020: D+18.7 2016: D+13.5 2012: D+5.8 2008: D+6.1
Not yet ingested
- Civics
- —
Market trends
- HPI YoY
- ▼ -63.56%
- Current HPI
- 261.4417
- Rent YoY
- ▲ 2.70%
- Metro
- Tucson, AZ
- State GDP YoY
- ▲ 4.54%
- F500 in state
- 20
Industry mix (Fortune 500 HQ in AZ)
| Industry | F500 HQs | Revenue |
|---|---|---|
| Technology | 2 | $13B |
|
||
| Mining / Metals | 1 | $23B |
|
||
| Environmental Services | 1 | $16B |
|
||
| Metals / Steel | 1 | $14B |
|
||
| Technology Distribution | 1 | $9B |
|
||
| Homebuilding | 1 | $8B |
|
||
Price history
+630.5% since first listed27 events — show timeline
- 2026-04-14 Listed $599,000 MLSSAZ
- 2026-03-15 Listing Removed — MLSSAZ
- 2025-11-22 Relisted — MLSSAZ
- 2025-11-19 Contingent — MLSSAZ
- 2025-10-29 Relisted — MLSSAZ
- 2025-10-15 Listing Removed — MLSSAZ
- 2025-10-01 Price Changed $579,900 MLSSAZ
- 2025-08-03 Listed $589,900 MLSSAZ
- 2004-03-19 Sold (MLS) $214,000 MLSSAZ
- 2003-12-26 Listed $229,900 MLSSAZ
- 2003-12-24 Listing Removed — MLSSAZ
- 2003-11-27 Listed $239,500 MLSSAZ
- 2003-10-24 Listing Removed — MLSSAZ
- 2003-06-17 Listed $225,000 MLSSAZ
- 2002-11-07 Sold (Public Records) $245,000 Public Records
- 1999-09-30 Listing Removed — MLSSAZ
- 1999-08-26 Sold (MLS) $181,000 MLSSAZ
- 1999-08-25 Sold (Public Records) $220,000 Public Records
- 1999-08-23 Sold (Public Records) $178,618 Public Records
- 1999-01-29 Listed $257,500 MLSSAZ
- 1998-10-05 Listed $220,000 MLSSAZ
- 1998-09-15 Listing Removed — MLSSAZ
- 1998-07-02 Listed $225,000 MLSSAZ
- 1994-07-01 Sold (Public Records) $177,625 Public Records
- 1994-07-01 Sold (MLS) $176,200 MLSSAZ
- 1993-12-17 Listed $176,200 MLSSAZ
- 1991-11-12 Sold (Public Records) $82,000 Public Records
Property tax history
+2.7%/yrLatest (2025): $4,464 · +4.4% YoY. Source: county tax records.
Cash-flow waterfall
monthlySold comps — $/sqft
last 12 mo · ≤1 miLoading sold comps…