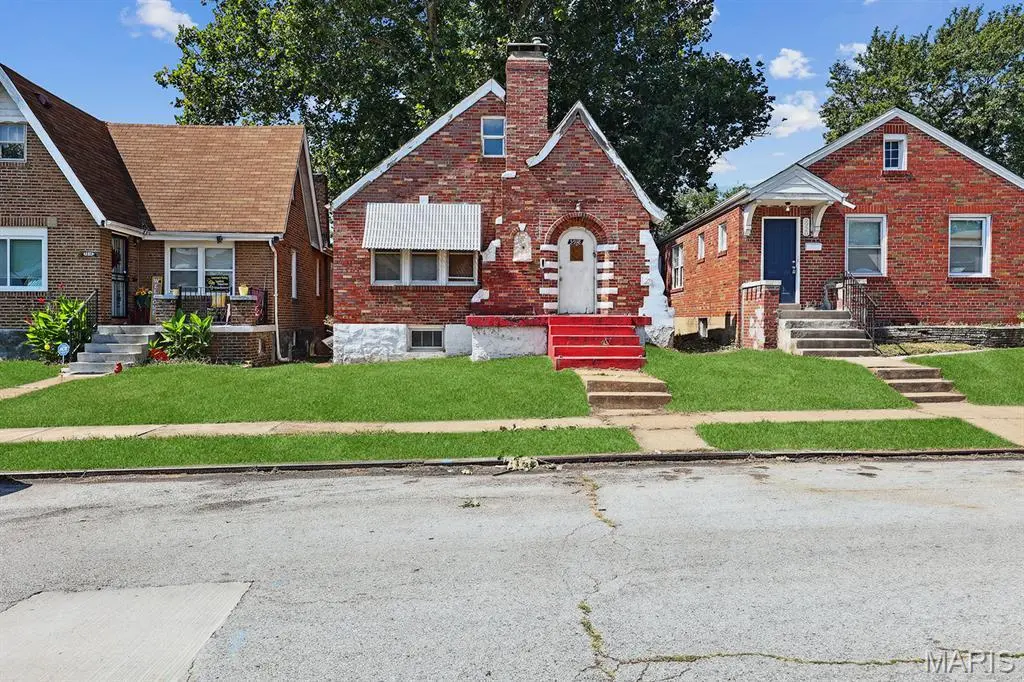
5918 Dressell Ave
St. Louis, MO 63120
$34,900B
4 bd · 1.0 ba ·
960 sqft ·
Built 1939
· SingleFamily
· Active
· 108 DOM
Cashflow @ list (25.0% down · 7.5%)
Estimated rent
$1,396/mo
Mortgage (P&I)
−$183
Tax + insurance
−$42
HOA
−$0
Vac / Maint / Mgmt
−$293
Net cashflow
$878/mo
Annual
$10,534/yr
Cap rate
36.48%
Cash-on-cash
107.79%
DSCR
5.80
1% rule
4.00%
Cash to close
$9,772
Investor read
- This is a 4-bed/1.0-bath single-family listed at $35k.
- At list price, monthly cash flow is $878 ($11k/yr) — positive.
- The deal already cash-flows at list — no discount required.
- Meets the 1% rule at list price ($1k rent vs $35k).
- It's been on market 108 days — a 9% lower offer ($32k) is reasonable based on typical stale-listing flexibility.
- Recommended offer: $32k (9.0% below list) — sets the bar for market timing.
- In year one you build about $429 of equity ($241 loan paydown + $188 appreciation (0.5% local appreciation)).
- Location reads: area grade B — affects rentability + tenant quality, not the cash-flow math above.
- St. Louis City (urban): math 10% / reading 18% proficiency, ranked #312 of 324 in MO (top 96%) — low school quality limits family demand, transient renter base, plan for 1-2y turnover; 80% free/reduced lunch — lower-income household profile, screen leases tightly.
- Zoned schools: Nahed Chapman New American Aca (math 2% / reading 2%, grade F, #1,099 of 1,115 statewide, top 100%, 335 students, 99% FRL); Gateway Middle (math 0% / reading 8%, grade F, #389 of 391 statewide, top 100%, 506 students, 99% FRL); Sumner High (math 2% / reading 2%, grade F, #520 of 521 statewide, top 100%, 264 students, 99% FRL) — zoned schools average 99% FRL vs 80% district-wide (19 pts higher); higher-poverty schools than district average — tighter screening recommended.
- Watch-outs: built in 1939 — expect roof / HVAC / electrical / plumbing capex.
- Market conditions: 20 active listings in the ZIP; 8 comparable units currently listed for rent nearby; rentals at typical pace (median 25d on market — plan ~3-4 weeks tenant-placement turnaround); lower-income renter base — watch delinquency; 294 units permitted in St. Louis city in 2024 (227 in 5+ unit buildings).
- St. Louis County population projected to shrink 6% by 2050 — rents likely to lag national; underwrite the cash flow, not the appreciation.
- 5 sale attempts since 3y ago; this cycle's ask has dropped $8k (18%) from the opening price — seller is motivated, your offer sets the floor, not the list.
- At projected returns (0.5% appreciation + 3.0% rent growth), your $10k cash investment doubles in ~1 year — after that, you're playing with house money.
- Climate carrying-cost: extreme-heat days projected 7→21/yr by 2055 (HVAC capex compounding) — expect insurance premiums to compound above CPI over the hold.
- Cap rate 36.5% vs local median 5.0% in St. Louis — top-decile yield for the area; either an underpriced asset or a hidden risk that comps aren't pricing in. Stress-test before assuming the spread holds.
- At $1,396/mo this rent would consume 48% of the median local household income ($35k/yr) (locally 555% of renters already pay >50% of income on rent) — very limited rent-growth headroom before tenants either downsize or default.
Questions for listing agent
- It's been on market 108 days. Have you received any prior offers? Is the seller open to a 9% concession, seller financing, or rate buy-down credit?
- Built in 1939 — when were the roof, HVAC, electrical panel, plumbing, and water heater last replaced?
- Why hasn't it sold? Are there any deal-killer items the seller is aware of (foundation, flood, title, zoning, code violations)?
- Is there a deadline driving the sale (1031 exchange, divorce, estate, relocation)? That informs how much negotiation room exists.
- What's the average days-on-market for RENTAL listings here right now (not sales)? A rising rental-DOM trend means longer vacancies and softer asking-rent achievability than the comps imply.
- What's the recent tenant-quality profile in this submarket — average credit score on applications, eviction rate, late-payment / NSF rate, and stable-employment percentage? A property-management company in the area should have these aggregated.
- How much new for-sale + rental construction is in the pipeline within 1–3 miles? Heavy new supply typically softens prices + rents 12–24 months out; constrained supply supports both.
CashFlowRE · CFR-ATZYH530N1Y4GA
· Data 20 h ago
cashflowre.app · 2026-05-29