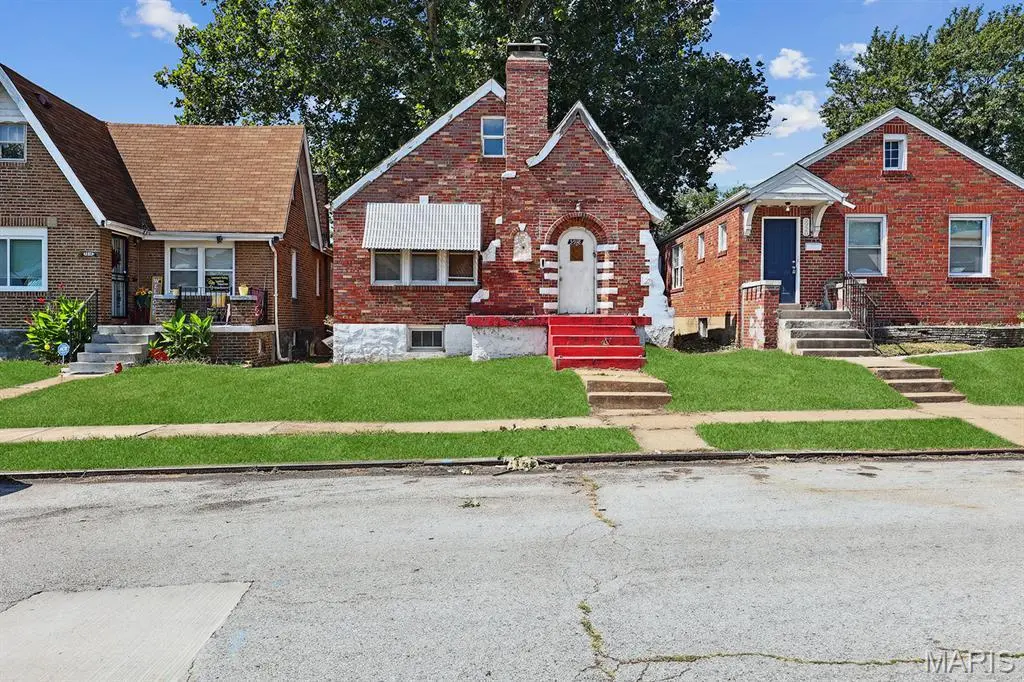
5918 Dressell Ave · St. Louis, MO
Flood risk 1/10 · Minimal
- FEMA flood zone
- X (unshaded)
- Chance of flooding over 30 yrs
- 0.0%
- Est. flood insurance / yr
- $473 – $860
Fire risk 1/10 · Minimal
- Est. fire insurance / yr
- $1,054 – $1,958
Heat risk 5/10 · Moderate
- Hot days now (above 107°F)
- 7 days/yr
- Hot days in 30 yrs
- 21 days/yr
Wind risk 2/10 · Minimal
- Chance of severe wind over 30 yrs
- 1.0%
Air-quality risk 4/10 · Minor
- Unhealthy air days now
- 4 days/yr
- Unhealthy air days in 30 yrs
- 5 days/yr
Risk factors via First Street. Map © Google.
Why this score? — see what drove the B grade
The composite is a weighted blend of 9 inputs, each scored 0–100. Each bar is that input's sub-score; the figure is the points it added to the 100-point composite (weight × sub-score).
- Cash flow +30.0/30.0
- 1% rule +10.0/10.0
- DSCR +10.0/10.0
- ARV discount +7.5/15.0
- Appreciation +5.3/10.0
- Rent growth +2.5/5.0
- Livability +2.5/5.0
- Condition / age +2.5/5.0
- Schools +1.2/10.0
$34,900
🖨 Deal sheet (PDF) 📄 Offer letter ✓ Due diligence
Listing remarks MLS
****Investment Opportunity**** Come see this great four bedroom property just minutes from major thoroughfares and amenities. With improvements, you can take advantage of the high cap rates in the area at an affordable price. A solid opportunity to add to your cash flow and rental portfolio. Sold in as-is condition. Schedule a showing today.
Key facts
- 3,441 sq ft lot
- Built 1939
- Listed 108 days
Neighborhood map
What this means for you Summary
Snapshot
- This is a 4-bed/1.0-bath single-family listed at $35k.
Deal economics
- At list price, monthly cash flow is $878 ($11k/yr) — positive.
- The deal already cash-flows at list — no discount required.
- Meets the 1% rule at list price ($1k rent vs $35k).
- Recommended offer: $32k (9.0% below list) — sets the bar for market timing.
- Cap rate 36.5% vs local median 5.0% in St. Louis — top-decile yield for the area; either an underpriced asset or a hidden risk that comps aren't pricing in. Stress-test before assuming the spread holds.
Location & tenants
- Location reads: area grade B — affects rentability + tenant quality, not the cash-flow math above.
- St. Louis City (urban): math 10% / reading 18% proficiency, ranked #312 of 324 in MO (top 96%) — low school quality limits family demand, transient renter base, plan for 1-2y turnover; 80% free/reduced lunch — lower-income household profile, screen leases tightly.
- Zoned schools: Nahed Chapman New American Aca (math 2% / reading 2%, grade F, #1,099 of 1,115 statewide, top 100%, 335 students, 99% FRL); Gateway Middle (math 0% / reading 8%, grade F, #389 of 391 statewide, top 100%, 506 students, 99% FRL); Sumner High (math 2% / reading 2%, grade F, #520 of 521 statewide, top 100%, 264 students, 99% FRL) — zoned schools average 99% FRL vs 80% district-wide (19 pts higher); higher-poverty schools than district average — tighter screening recommended.
- Market conditions: 20 active listings in the ZIP; 8 comparable units currently listed for rent nearby; rentals at typical pace (median 25d on market — plan ~3-4 weeks tenant-placement turnaround); lower-income renter base — watch delinquency; 294 units permitted in St. Louis city in 2024 (227 in 5+ unit buildings).
- At $1,396/mo this rent would consume 48% of the median local household income ($35k/yr) (locally 555% of renters already pay >50% of income on rent) — very limited rent-growth headroom before tenants either downsize or default.
Forward outlook
- In year one you build about $429 of equity ($241 loan paydown + $188 appreciation (0.5% local appreciation)).
- St. Louis County population projected to shrink 6% by 2050 — rents likely to lag national; underwrite the cash flow, not the appreciation.
- At projected returns (0.5% appreciation + 3.0% rent growth), your $10k cash investment doubles in ~1 year — after that, you're playing with house money.
Negotiation context
- It's been on market 108 days — a 9% lower offer ($32k) is reasonable based on typical stale-listing flexibility.
- 5 sale attempts since 3y ago; this cycle's ask has dropped $8k (18%) from the opening price — seller is motivated, your offer sets the floor, not the list.
Risks & watch-outs
- Watch-outs: built in 1939 — expect roof / HVAC / electrical / plumbing capex.
- Climate carrying-cost: extreme-heat days projected 7→21/yr by 2055 (HVAC capex compounding) — expect insurance premiums to compound above CPI over the hold.
Questions for the listing agent
- It's been on market 108 days. Have you received any prior offers? Is the seller open to a 9% concession, seller financing, or rate buy-down credit?
- Built in 1939 — when were the roof, HVAC, electrical panel, plumbing, and water heater last replaced?
- Why hasn't it sold? Are there any deal-killer items the seller is aware of (foundation, flood, title, zoning, code violations)?
- Is there a deadline driving the sale (1031 exchange, divorce, estate, relocation)? That informs how much negotiation room exists.
- What's the average days-on-market for RENTAL listings here right now (not sales)? A rising rental-DOM trend means longer vacancies and softer asking-rent achievability than the comps imply.
- What's the recent tenant-quality profile in this submarket — average credit score on applications, eviction rate, late-payment / NSF rate, and stable-employment percentage? A property-management company in the area should have these aggregated.
- How much new for-sale + rental construction is in the pipeline within 1–3 miles? Heavy new supply typically softens prices + rents 12–24 months out; constrained supply supports both.
Investment metrics
- 1% rule
- 4.00% ✓
- Cap rate
- 36.48%
- Cash-on-cash
- 107.79%
- DSCR
- 5.80
- GRM
- 2.1
CMA / ARV
- ARV (median comp)
- $73,753
- List price
- $34,900
- Delta
- -52.68%
- Verdict
- UNDERPRICED
- Comps
- 20 within 1.0 mi
Show comp detail 12 sales within ~0.75 mi
| Address | Dist | Beds/Ba | Sqft | Sold | Price | $/sf | Match |
|---|---|---|---|---|---|---|---|
| 4325 Dardenne Dr | 0.26mi | 3/1.0 (-1) | 932 (-3%) | 13mo | $94,900 | $102 | 67 |
| 3914 Philbrook Ave | 0.28mi | 3/1.0 (-1) | 936 (-2%) | 18mo | $119,000 | $127 | 63 |
| 6241 Lorraine Ave | 0.57mi | 3/1.0 (-1) | 950 (-1%) | 4mo | $57,900 | $61 | 63 |
| 6219 Dardanella Ave | 0.41mi | 3/1.0 (-1) | 980 (+2%) | 13mo | $34,900 | $36 | 62 |
| 6206 Lorraine Ave | 0.51mi | 3/1.0 (-1) | 918 (-4%) | 6mo | $69,900 | $76 | 59 |
| 3928 Oakwood Ave | 0.55mi | 3/1.0 (-1) | 956 (-0%) | 17mo | $49,000 | $51 | 54 |
| 3331 Oakdale Ave | 0.64mi | 3/1.0 (-1) | 988 (+3%) | 12mo | $54,900 | $56 | 50 |
| 2505 Crescent Ave | 0.48mi | 3/1.0 (-1) | 850 (-12%) | 5mo | $100,000 | $118 | 49 |
| 6114 Wyma Ave | 0.62mi | 3/1.0 (-1) | 1,060 (+10%) | 4mo | $132,000 | $125 | 45 |
| 6449 Myron Ave | 0.69mi | 4/1.0 | 1,066 (+11%) | 8mo | $145,000 | $136 | 43 |
| 4107 Cedarwood Ave | 0.52mi | 3/1.0 (-1) | 876 (-9%) | 17mo | $20,750 | $24 | 42 |
| 3711 Sylvan Pl | 0.62mi | 3/1.0 (-1) | 820 (-15%) | 5mo | $134,900 | $165 | 38 |
Match score weights: distance 35% · size 25% · config 20% · recency 20%. Top-matched comps best support the ARV.
Projected returns pro-forma
0.54% appreciation · 3.0% rent growth · sell at horizon
- IRR
- —
- Equity multiple
- 6.71×
- Total profit
- $55,793
- Equity at exit
- $11,085
- IRR
- —
- Equity multiple
- 13.92×
- Total profit
- $126,232
- Equity at exit
- $14,110
Cash invested: $9,772 (down + closing). Projections, not guarantees.
Landlord ↔ Tenant lean methodology
- Overall (STATE)
- 81 Strongly Landlord-Friendly
- State Missouri
- 81 Strongly Landlord-Friendly · R+10
- County
- — inherits STATE
- City
- — inherits STATE
ZIP-level market 63120
- Home prices YoY
- 0.4%
- Active inventory
- 20
- Price-to-rent
- 2.1×
Monthly cashflow live
- Estimated rent
- $1,396 high interval (Pro) →
- Mortgage (P&I)
- −$183
- Tax from tax record
- −$28 /mo · $333/yr
- Insurance
- −$15
- HOA
- −$0
- Vacancy / Maint / Mgmt
- −$293
- Net cashflow
- $878
Break-even live
Sensitivity live
| Price | -10% $898 | -5% $888 | +0% $878 | +5% $868 | +10% $858 |
|---|---|---|---|---|---|
| Rent | -10% $767 | -5% $823 | +0% $878 | +5% $933 | +10% $988 |
| Rate | -1.0pp $895 | -0.5pp $887 | base $878 | +0.5pp $869 | +1.0pp $860 |
UW: 25.0% down · 7.5% · 30yr · 1.5% tax · 5.0% vac · 8.0% maint · 8.0% mgmt
Financing live
Cash to close
- Down payment
- $8,725
- Closing costs
- $1,047
- Reserves months
- —
- Total cash needed
- —
Loan-product check · same deal, 3 products live
Conventional
25% down · 7.5% · 30yr
- Down + closing
- —
- Monthly P&I
- —
- Monthly cashflow
- —
- DSCR
- —
- Eligible?
- —
Personal DTI + credit; lowest rate.
DSCR
20% down · 8.5% · 30yr
- Down + closing
- —
- Monthly P&I
- —
- Monthly cashflow
- —
- DSCR
- —
- Eligible?
- —
No personal income docs; deal must DSCR.
Hard money
10% down · 12.0% · 12mo
- Down + closing
- —
- Monthly P&I
- —
- Monthly cashflow
- —
- DSCR
- —
- Eligible?
- —
Short-term bridge; refi at stabilization.
Rent comps 8 comps
| Address | Beds | Baths | Sqft | Rent | $/sqft | DOM | Units | Dist |
|---|---|---|---|---|---|---|---|---|
| 5824 Ferris Ave Saint Louis, MO | 4.0 | 2.0 | 1008 | $1,500 | $1.49 | 45d | 1 | 0.11mi |
| 5818 Ferris Ave Saint Louis, MO | 3.0 | 1.0 | 1014 | $1,500 | $1.48 | 45d | 1 | 0.12mi |
| 4935 Alcott Ave Saint Louis, MO | 3.0 | 1.0 | 680 | $705 | $1.04 | 18d | 1 | 1.08mi |
| 1965 Arlington Ave Saint Louis, MO | 3.0 | 1.0 | 980 | $1,300 | $1.33 | 6d | 1 | 1.24mi |
| 5936 Theodore Ave Saint Louis, MO | 3.0 | 2.0 | 1008 | $1,350 | $1.34 | 45d | 1 | 1.24mi |
| 5361 Wilborn Dr Saint Louis, MO | 3.0 | 1.0 | 900 | $1,420 | $1.58 | 19d | 1 | 1.25mi |
| 5347 Janet Ave Saint Louis, MO | 4.0 | 1.0 | 893 | $1,350 | $1.51 | 18d | 1 | 1.32mi |
| 5225 Fletcher St Saint Louis, MO | 3.0 | 2.0 | 918 | $1,295 | $1.41 | 25d | 1 | 1.39mi |
Listing history 27 events
-
2026-06-21days on market $34,900 Active 108 DOM
-
2026-06-18days on market $34,900 Active 105 DOM
-
2026-06-17days on market $34,900 Active 104 DOM
-
2026-06-16days on market $34,900 Active 103 DOM
-
2026-06-15days on market $34,900 Active 102 DOM
-
2026-06-13days on market $34,900 Active 100 DOM
-
2026-06-09days on market $34,900 Active 96 DOM
-
2026-06-08days on market $34,900 Active 95 DOM
-
2026-06-08days on market $34,900 Active 94 DOM
-
2026-06-05days on market $34,900 Active 91 DOM
-
2026-06-03days on market $34,900 Active 90 DOM
-
2026-06-02days on market $34,900 Active 89 DOM
-
2026-06-01days on market $34,900 Active 88 DOM
-
2026-05-31days on market $34,900 Active 87 DOM
-
2026-05-18status Active 343-char remark
Show marketing remark (343 chars)
****Investment Opportunity**** Come see this great four bedroom property just minutes from major thoroughfares and amenities. With improvements, you can take advantage of the high cap rates in the area at an affordable price. A solid opportunity to add to your cash flow and rental portfolio. Sold in as-is condition. Schedule a showing today.
-
2026-05-18price $34,900 343-char remark
Show marketing remark (343 chars)
****Investment Opportunity**** Come see this great four bedroom property just minutes from major thoroughfares and amenities. With improvements, you can take advantage of the high cap rates in the area at an affordable price. A solid opportunity to add to your cash flow and rental portfolio. Sold in as-is condition. Schedule a showing today.
-
2026-05-04status Pending 343-char remark
Show marketing remark (343 chars)
****Investment Opportunity**** Come see this great four bedroom property just minutes from major thoroughfares and amenities. With improvements, you can take advantage of the high cap rates in the area at an affordable price. A solid opportunity to add to your cash flow and rental portfolio. Sold in as-is condition. Schedule a showing today.
-
2026-02-19$42,500 Active 343-char remark
Show marketing remark (343 chars)
****Investment Opportunity**** Come see this great four bedroom property just minutes from major thoroughfares and amenities. With improvements, you can take advantage of the high cap rates in the area at an affordable price. A solid opportunity to add to your cash flow and rental portfolio. Sold in as-is condition. Schedule a showing today.
-
2024-09-10$39,900 Active
-
2023-07-16historical
-
2023-04-12price $38,000
-
2023-03-02status Active
-
2023-02-20status Pending
-
2023-01-13$44,500 Active
-
2004-05-05soldstatus $82,900
-
2003-04-25soldstatus
-
2002-11-15soldstatus
ⓘ Source: listings_history table (triggers on properties + properties_extension) + one-shot
backfill from property_details.listing_events for pre-trigger history.
Tax reassessment forecast MO · Resets to sale price
- Current annual tax
- $333 · $28/mo
- Projected year-2 tax
- $339 · $28/mo
- Expected delta
- +$6/yr ($0/mo · 1.7%)
ⓘ Screening estimate from a state-policy table — verify with the county assessor before closing.
Climate risk First Street
- Flood 1/10 Low FEMA zone X (unshaded) · 0% chance over 30 yrs
- Wildfire 1/10 Low
- Heat 5/10 Major 7 d/yr ≥107°F today · 21 d/yr by 30 yrs out
- Wind 2/10 Low 100% chance of damaging wind over 30 yrs
- Air quality 4/10 Moderate 4 unhealthy d/yr today · 5 by 30 yrs out
Nearby sold comps map
Loading sold comps map…
Walkable amenities ~0.75 mi
Loading nearby amenities…
Taxation est. · year 1
- Rental income
- $16,756
- − Mortgage interest
- −$1,955
- − Property taxes
- −$333
- − Insurance
- −$174
- − Repairs & maintenance
- −$1,340
- − Management
- −$1,340
- − Depreciation
- −$1,015
- Taxable income
- $10,597
- Est. tax owed @ 24.0%
- −$2,543
- After-tax cash flow
- $7,990/yr
For passive investors: Depreciation is non-cash, so a rental often shows a tax loss while cash-flowing — sheltering income. Rental losses are passive: they offset passive income freely, and up to $25,000/yr can offset ordinary (W-2) income if you actively participate and your MAGI is under $100k (phasing out to $0 by $150k); unused losses carry forward. On sale, claimed depreciation is recaptured at up to 25%, and gains may owe capital-gains tax (a 1031 exchange can defer both). Figures are a year-1 estimate at your 24.0% rate — not tax advice; consult a CPA.
Schools (NCES district)
- District
- St. Louis City
- NCES district ID
- 2929280
- Math proficiency
- 10% ▼ -6.00%
- Reading proficiency
- 18% ▼ -3.00%
- Median HH income
- $35,685
- Composite
- 11.54/100
- National rank
- #9699
- State rank
- #312 of 324 in MO
Livability — St. Louis
No livability data for this city. (Only ~50 U.S. cities are tracked.)
Census & demographics
- Census place
- St. Louis, MO
- County
- Saint Louis City · 254,015 people
- City population
- 283,259
- Metro
- St. Louis, MO-IL
- Population (ZIP)
- 6,790
- Household income
- $35,176
- Rent vs Own
- Severe rent burden
- 555.0
Population outlook (St. Louis County) Hauer SSP2
- Today (2025)
- 315,737 people
- By 2030
- 313,865 · -0.6%
- By 2040
- 305,439 · -3.3%
- By 2050
- 296,529 · -6.1%
- By 2075
- 271,028 · -14.2%
- By 2100
- 255,359 · -19.1%
Race, ethnicity, and origin ACS 2023
- Neighborhood character
- Predominantly Black (90%)
- Race & ethnicity
- Black 90% Two or more races 7% White 2%
- Foreign-born
- 1% · Canada
- Languages at home
- 97% English-only · Spanish 1% French/Haitian/Cajun 1%
Political lean MEDSL · St. Louis
- 2024 margin
- Solid D (+64.7) · D 81.4% · R 16.7% · Other 2.0%
- 2008→2024 swing
- -3.5pp toward R · 2008: 68.2pp · 2024: 64.7pp
- All cycles
- 2024: D+64.7 2020: D+66.2 2016: D+63.7 2012: D+66.6 2008: D+68.2
Not yet ingested
- Civics
- —
Market trends
- HPI YoY
- ▲ 0.54%
- Current HPI
- 141.8177
- Rent YoY
- —
- Metro
- St. Louis, MO-IL
- State GDP YoY
- ▲ 1.84%
- F500 in state
- 20
Industry mix (Fortune 500 HQ in MO)
| Industry | F500 HQs | Revenue |
|---|---|---|
| Healthcare | 1 | $163B |
|
||
| Insurance | 1 | $21B |
|
||
| Industrial Technology | 1 | $17B |
|
||
| Retail | 1 | $16B |
|
||
| Industrial Distribution | 1 | $10B |
|
||
| Utilities | 1 | $9B |
|
||
Price history
-57.9% since first listed13 events — show timeline
- 2026-05-18 Relisted — MARIS as Distributed by MLS Grid
- 2026-05-18 Price Changed $34,900 MARIS as Distributed by MLS Grid
- 2026-05-04 Pending — MARIS as Distributed by MLS Grid
- 2026-02-19 Listed $42,500 MARIS as Distributed by MLS Grid
- 2024-09-10 Listed $39,900 MARIS as Distributed by MLS Grid
- 2023-07-16 Delisted — MARIS as Distributed by MLS Grid
- 2023-04-12 Price Changed $38,000 MARIS as Distributed by MLS Grid
- 2023-03-02 Relisted — MARIS as Distributed by MLS Grid
- 2023-02-20 Pending — MARIS as Distributed by MLS Grid
- 2023-01-13 Listed $44,500 MARIS as Distributed by MLS Grid
- 2004-05-05 Sold (Public Records) $82,900 Public Records
- 2003-04-25 Sold (Public Records) — Public Records
- 2002-11-15 Sold (Public Records) — Public Records
Property tax history
-6.3%/yrLatest (2024): $333 · +4.7% YoY. Source: county tax records.
Cash-flow waterfall
monthlySold comps — $/sqft
last 12 mo · ≤1 miLoading sold comps…