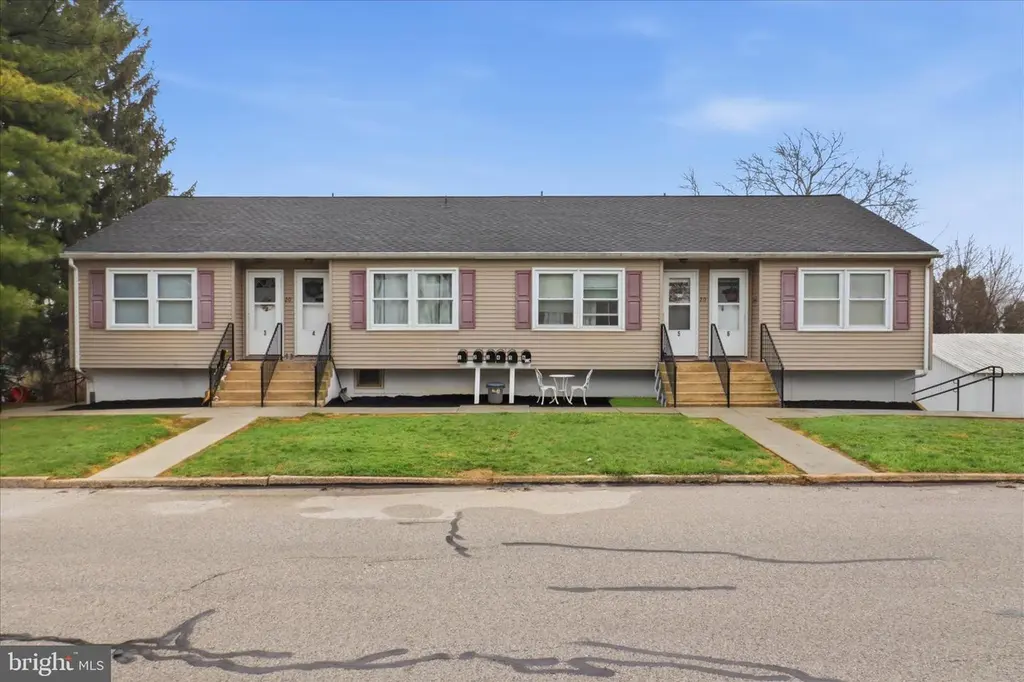
20 E Gay St
Red Lion, PA 17356
$858,500D-
48 bd · None ba ·
4,090 sqft ·
Built 1970
· MultiFamily
· Pending
· 3 DOM
Cashflow @ list (25.0% down · 7.5%)
Estimated rent
$6,320/mo
Mortgage (P&I)
−$4,502
Tax + insurance
−$822
HOA
−$0
Vac / Maint / Mgmt
−$1,327
Net cashflow
$-331/mo
Annual
$-3,978/yr
Cap rate
5.83%
Cash-on-cash
-1.65%
DSCR
0.93
1% rule
0.74%
Cash to close
$240,380
Investor read
- This is a 2×2bd/1ba + 4×1bd/1ba units multifamily listed at $858k.
- At list price, monthly cash flow is $-331 ($-4k/yr) — negative. Per door: $-55/mo.
- To cash-flow at today's rent, offer at most $800k (6.8% below list).
- To meet the 1% rule (rent ≥ 1% of price), the offer needs to be $632k (26.4% below list).
- Only 3 days on market — expect competitive offers; lowballing is unlikely to land.
- Recommended offer: $632k (26.4% below list) — sets the bar for 1% rule.
- Local home prices are declining (-3.0%/yr); year-one equity from $6k of loan paydown is wiped out by about $26k of value loss. Plan a longer hold.
- Location reads 77/100 on livability (#349 in PA, #3,056 nationally) — a middle-class / working-renter tenant base. Strengths: cost of living A+, housing A+, health & safety A+; Watch: amenities D, commute F.
- Red Lion Area SD (suburban): math 36% / reading 50% proficiency, ranked #282 of 539 in PA (top 52%) — families likely to look elsewhere, expect single-tenant / working-renter base with shorter leases.
- Market conditions: 147 active listings in the ZIP; solid renter incomes; 1,328 units permitted in York County in 2024 (338 in 5+ unit buildings).
- Climate carrying-cost: extreme-heat days projected 7→15/yr by 2055 (HVAC capex compounding) — expect insurance premiums to compound above CPI over the hold.
- Cap rate 5.8% vs local median 4.5% in Red Lion — meaningfully above typical; check what's discounted (condition, days-on-market, listing class) to confirm the premium yield is real.
- At $6,320/mo this rent would consume 88% of the median local household income ($87k/yr) (locally 559% of renters already pay >50% of income on rent) — very limited rent-growth headroom before tenants either downsize or default.
Questions for listing agent
- What do current leases actually rent for vs. the listed asking? Can we see a recent rent roll and the last 12 months of T-12 income?
- Can we see the unit-by-unit rent roll, current vacancy, and any below-market leases? What's the average tenancy length?
- What capital expenditures (roof, boiler, parking lot, exteriors) have been made in the last 5 years, and what's planned in the next 2?
- Built in 1970 — when were the roof, HVAC, electrical panel, plumbing, and water heater last replaced?
- Is there a deadline driving the sale (1031 exchange, divorce, estate, relocation)? That informs how much negotiation room exists.
- The area grade is low — what's the realistic commute time and amenity access for the typical tenant pool here? Any planned neighborhood developments (good or bad) we should know about?
- What's the average days-on-market for RENTAL listings here right now (not sales)? A rising rental-DOM trend means longer vacancies and softer asking-rent achievability than the comps imply.
- What's the recent tenant-quality profile in this submarket — average credit score on applications, eviction rate, late-payment / NSF rate, and stable-employment percentage? A property-management company in the area should have these aggregated.
CashFlowRE · CFR-AV6MM5D28JDG8C
· Data 3 weeks ago
cashflowre.app · 2026-05-29