 6-Plex
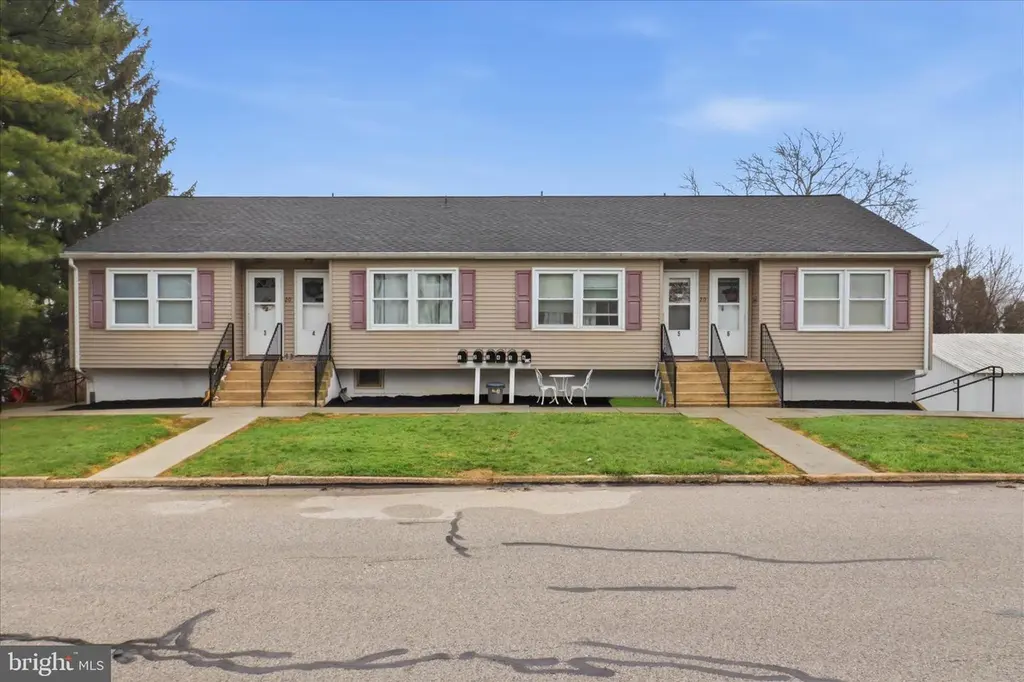
20 E Gay St · Red Lion, PA
Flood risk 1/10 · Minimal
- FEMA flood zone
- X (unshaded)
- Chance of flooding over 30 yrs
- 0.0%
- Est. flood insurance / yr
- $473 – $860
Fire risk 1/10 · Minimal
- Est. fire insurance / yr
- $511 – $949
Heat risk 5/10 · Moderate
- Hot days now (above 100°F)
- 7 days/yr
- Hot days in 30 yrs
- 15 days/yr
Wind risk 4/10 · Minor
- Chance of severe wind over 30 yrs
- 14.0%
Air-quality risk 3/10 · Minor
- Unhealthy air days now
- 2 days/yr
- Unhealthy air days in 30 yrs
- 5 days/yr
Risk factors via First Street. Map © Google.
Why this score? — see what drove the D- grade
The composite is a weighted blend of 9 inputs, each scored 0–100. Each bar is that input's sub-score; the figure is the points it added to the 100-point composite (weight × sub-score).
- Cash flow +11.2/30.0
- ARV discount +7.5/15.0
- Livability +3.9/5.0
- Schools +3.8/10.0
- DSCR +3.3/10.0
- Rent growth +2.5/5.0
- Condition / age +2.5/5.0
- 1% rule +2.4/10.0
- Appreciation +0.0/10.0
$858,500
🖨 Deal sheet 📄 Offer letter ✓ Due diligence
Multi-family units
County records classify this as Multi-Family (5+ Unit). Listing-text estimate: 6 units. confirmed
5+ unit building — per-unit beds/baths from public records are typically unavailable; the breakdown below (if shown) is an estimate from the listing text.
Listing remarks
This well-maintained 6-unit multifamily property presents a turnkey investment opportunity in Red Lion. The building consists of two 2-bedroom, 1-bath units and four 1-bedroom, 1-bath units, offering a desirable unit mix that appeals to a wide range of tenants. Designed for ease of ownership and strong cash flow potential, tenants are responsible for nearly all operating expenses, helping to keep owner costs low and maximize net income. The property also features separately metered utilities, including water, providing additional efficiency and expense control. Numerous capital improvements have already been completed, allowing the next owner to step into a stabilized, low-maintenance asset
Key facts
- Paved parking lot
- 0.3 acre lot
- 8 parking spots
Tags
Neighborhood map
What this means for you Summary
Snapshot
- This is a 2×2bd/1ba + 4×1bd/1ba units multifamily listed at $858k.
Deal economics
- At list price, monthly cash flow is $-331 ($-4k/yr) — negative. Per door: $-55/mo.
- To cash-flow at today's rent, offer at most $800k (6.8% below list).
- To meet the 1% rule (rent ≥ 1% of price), the offer needs to be $632k (26.4% below list).
- Recommended offer: $632k (26.4% below list) — sets the bar for 1% rule.
- Cap rate 5.8% vs local median 4.5% in Red Lion — meaningfully above typical; check what's discounted (condition, days-on-market, listing class) to confirm the premium yield is real.
Location & tenants
- Location reads 77/100 on livability (#349 in PA, #3,056 nationally) — a middle-class / working-renter tenant base. Strengths: cost of living A+, housing A+, health & safety A+; Watch: amenities D, commute F.
- Red Lion Area SD (suburban): math 36% / reading 50% proficiency, ranked #282 of 539 in PA (top 52%) — families likely to look elsewhere, expect single-tenant / working-renter base with shorter leases.
- Market conditions: 147 active listings in the ZIP; solid renter incomes; 1,328 units permitted in York County in 2024 (338 in 5+ unit buildings).
- At $6,320/mo this rent would consume 88% of the median local household income ($87k/yr) (locally 559% of renters already pay >50% of income on rent) — very limited rent-growth headroom before tenants either downsize or default.
Forward outlook
- Local home prices are declining (-3.0%/yr); year-one equity from $6k of loan paydown is wiped out by about $26k of value loss. Plan a longer hold.
Negotiation context
- Only 3 days on market — expect competitive offers; lowballing is unlikely to land.
Risks & watch-outs
- Climate carrying-cost: extreme-heat days projected 7→15/yr by 2055 (HVAC capex compounding) — expect insurance premiums to compound above CPI over the hold.
Questions for the listing agent
- What do current leases actually rent for vs. the listed asking? Can we see a recent rent roll and the last 12 months of T-12 income?
- Can we see the unit-by-unit rent roll, current vacancy, and any below-market leases? What's the average tenancy length?
- What capital expenditures (roof, boiler, parking lot, exteriors) have been made in the last 5 years, and what's planned in the next 2?
- Built in 1970 — when were the roof, HVAC, electrical panel, plumbing, and water heater last replaced?
- Is there a deadline driving the sale (1031 exchange, divorce, estate, relocation)? That informs how much negotiation room exists.
- The area grade is low — what's the realistic commute time and amenity access for the typical tenant pool here? Any planned neighborhood developments (good or bad) we should know about?
- What's the average days-on-market for RENTAL listings here right now (not sales)? A rising rental-DOM trend means longer vacancies and softer asking-rent achievability than the comps imply.
- What's the recent tenant-quality profile in this submarket — average credit score on applications, eviction rate, late-payment / NSF rate, and stable-employment percentage? A property-management company in the area should have these aggregated.
- How much new apartment / multifamily construction is in the pipeline within 1–3 miles? Heavy new supply (>2% of stock underway) typically softens rents 12–24 months out; light construction supports rent growth.
Investment metrics
- 1% rule
- 0.74% ✗
- Cap rate
- 5.83%
- Cash-on-cash
- -1.65%
- DSCR
- 0.93
- GRM
- 11.3
CMA / ARV
No comps found within radius.
Projected returns pro-forma
-3.0% appreciation · 3.0% rent growth · sell at horizon
- IRR
- -19.1%
- Equity multiple
- 0.33×
- Total profit
- $-160,505
- Equity at exit
- $128,005
- IRR
- -11.7%
- Equity multiple
- 0.30×
- Total profit
- $-168,083
- Equity at exit
- $74,227
Cash invested: $240,380 (down + closing). Projections, not guarantees.
Landlord ↔ Tenant lean methodology
- Overall (STATE)
- 62 Landlord-Friendly
- State Pennsylvania
- 62 Landlord-Friendly · EVEN
- County
- — inherits STATE
- City
- — inherits STATE
ZIP-level market 17356
- Home prices YoY
- -21.0%
- Active inventory
- 147
- Price-to-rent
- 64.7×
Monthly cashflow live
- Estimated rent
- $6,320 high interval (Pro) →
- Mortgage (P&I)
- −$4,502
- Tax from tax record
- −$465 /mo · $5,574/yr
- Insurance
- −$358
- HOA
- −$0
- Vacancy / Maint / Mgmt
- −$1,327
- Net cashflow
- $-331
Break-even live
6-unit breakdown (identical units grouped — click to expand)
| Units | Beds | Baths | Est. rent |
|---|---|---|---|
| 2× units | 2 | 1 | $2,212 |
| #1 | 2 | 1 | $1,106 |
| #2 | 2 | 1 | $1,106 |
| 4× units | 1 | 1 | $4,108 |
| #3 | 1 | 1 | $1,027 |
| #4 | 1 | 1 | $1,027 |
| #5 | 1 | 1 | $1,027 |
| #6 | 1 | 1 | $1,027 |
| Total (6 units) | $6,320 | ||
UW: 25.0% down · 7.5% · 30yr · 1.5% tax · 5.0% vac · 8.0% maint · 8.0% mgmt
Financing live
Cash to close
- Down payment
- $214,625
- Closing costs
- $25,755
- Reserves months
- —
- Total cash needed
- —
Loan-product check · same deal, 3 products live
Conventional
25% down · 7.5% · 30yr
- Down + closing
- —
- Monthly P&I
- —
- Monthly cashflow
- —
- DSCR
- —
- Eligible?
- —
Personal DTI + credit; lowest rate.
DSCR
20% down · 8.5% · 30yr
- Down + closing
- —
- Monthly P&I
- —
- Monthly cashflow
- —
- DSCR
- —
- Eligible?
- —
No personal income docs; deal must DSCR.
Hard money
10% down · 12.0% · 12mo
- Down + closing
- —
- Monthly P&I
- —
- Monthly cashflow
- —
- DSCR
- —
- Eligible?
- —
Short-term bridge; refi at stabilization.
Listing history 2 events
-
2026-04-14status Pending
-
2026-04-11$858,500 Active
ⓘ Source: listings_history table (triggers on properties + properties_extension) + one-shot
backfill from property_details.listing_events for pre-trigger history.
Tax reassessment forecast PA · Partial reset (capped growth)
- Current annual tax
- $5,574 · $465/mo
- Projected year-2 tax
- $9,569 · $797/mo
- Expected delta
- +$3,995/yr (+$333/mo · 71.7%)
ⓘ Screening estimate from a state-policy table — verify with the county assessor before closing.
Climate risk First Street
- Flood 1/10 Low FEMA zone X (unshaded) · 0% chance over 30 yrs
- Wildfire 1/10 Low
- Heat 5/10 Major 7 d/yr ≥100°F today · 15 d/yr by 30 yrs out
- Wind 4/10 Moderate 14% chance of damaging wind over 30 yrs
- Air quality 3/10 Moderate 2 unhealthy d/yr today · 5 by 30 yrs out
Nearby sold comps map
Loading sold comps map…
Walkable amenities ~0.75 mi
Loading nearby amenities…
Taxation est. · year 1
- Rental income
- $75,840
- − Mortgage interest
- −$48,089
- − Property taxes
- −$5,574
- − Insurance
- −$4,292
- − Repairs & maintenance
- −$6,067
- − Management
- −$6,067
- − Depreciation
- −$24,975
- Taxable loss
- −$19,225
- Est. tax savings @ 24.0%
- +$4,614
- After-tax cash flow
- $636/yr
For passive investors: Depreciation is non-cash, so a rental often shows a tax loss while cash-flowing — sheltering income. Rental losses are passive: they offset passive income freely, and up to $25,000/yr can offset ordinary (W-2) income if you actively participate and your MAGI is under $100k (phasing out to $0 by $150k); unused losses carry forward. On sale, claimed depreciation is recaptured at up to 25%, and gains may owe capital-gains tax (a 1031 exchange can defer both). Figures are a year-1 estimate at your 24.0% rate — not tax advice; consult a CPA.
Schools (NCES district)
- District
- Red Lion Area SD
- NCES district ID
- 4220100
- Math proficiency
- 36% ▼ -10.00%
- Reading proficiency
- 50% ▼ -10.00%
- Median HH income
- $60,225
- Composite
- 37.91/100
- National rank
- #4313
- State rank
- #282 of 539 in PA
Livability — Red Lion
- Score
- 77/100
- State rank
- #349
- US rank
- #3056
Category grades
Schools grade is shown separately in the Schools card above.
Census & demographics
- Census place
- Red Lion, PA
- County
- York County · 278,806 people
- City population
- 22,869
- Metro
- York-Hanover, PA
- Population (ZIP)
- 22,869
- Household income
- $86,561
- Rent vs Own
- Severe rent burden
- 559.0
Population outlook (York County) Hauer SSP2
- Today (2025)
- 454,205 people
- By 2030
- 457,407 · +0.7%
- By 2040
- 457,529 · +0.7%
- By 2050
- 448,261 · -1.3%
- By 2075
- 427,388 · -5.9%
- By 2100
- 384,218 · -15.4%
Race, ethnicity, and origin ACS 2023
- Neighborhood character
- Predominantly White (89%)
- Race & ethnicity
- White 89% Black 4% Two or more races 4% Asian 2% Hispanic / Latino 2%
- Common ancestry
- Romanian 3% Slovak 3% Serbian 2%
- Foreign-born
- 4% · China
- Languages at home
- 95% English-only · Russian/Polish/Slavic 1% Chinese 1% Other Indo-European 1%
Political lean MEDSL · York
- 2024 margin
- Strong R (+25.3) · D 36.9% · R 62.1%
- 2008→2024 swing
- -11.7pp toward R · 2008: -13.6pp · 2024: -25.3pp
- All cycles
- 2024: R+25.3 2020: R+24.6 2016: R+29.3 2012: R+21.2 2008: R+13.6
Not yet ingested
- Civics
- —
Market trends
- HPI YoY
- ▼ -69.16%
- Current HPI
- 259.7294
- Rent YoY
- —
- Metro
- York-Hanover, PA
- State GDP YoY
- ▲ 1.68%
- F500 in state
- 34
Industry mix (Fortune 500 HQ in PA)
| Industry | F500 HQs | Revenue |
|---|---|---|
| Healthcare | 2 | $309B |
|
||
| Insurance | 2 | $27B |
|
||
| Telecommunications / Media | 1 | $124B |
|
||
| Industrial Distribution | 1 | $22B |
|
||
| Financial Services | 1 | $20B |
|
||
| Chemicals / Materials | 1 | $18B |
|
||
Price history
2 events — show timeline
- 2026-04-14 Pending — BRIGHT MLS
- 2026-04-11 Listed $858,500 BRIGHT MLS
Property tax history
+0.9%/yrLatest (2025): $5,574 · +3.0% YoY. Source: county tax records.
Cash-flow waterfall
monthlySold comps — $/sqft
last 12 mo · ≤1 miLoading sold comps…