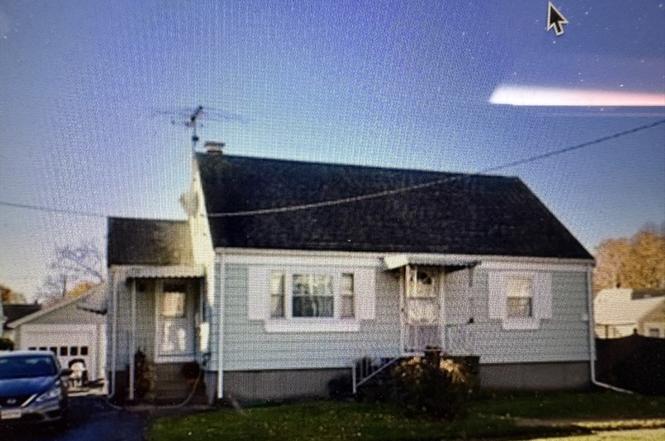
20 Beacon Blvd
Peabody, MA 01960
$374,900C
4 bd · 1.0 ba ·
1,236 sqft ·
Built 1951
· SingleFamily
· Active
· 81 DOM
Cashflow @ list (25.0% down · 7.5%)
Estimated rent
$3,783/mo
Mortgage (P&I)
−$1,966
Tax + insurance
−$523
HOA
−$0
Vac / Maint / Mgmt
−$794
Net cashflow
$500/mo
Annual
$5,997/yr
Cap rate
7.89%
Cash-on-cash
5.71%
DSCR
1.25
1% rule
1.01%
Cash to close
$104,972
Investor read
- This is a 4-bed/1.0-bath single-family listed at $375k.
- At list price, monthly cash flow is $500 ($6k/yr) — positive.
- The deal already cash-flows at list — no discount required.
- Meets the 1% rule at list price ($4k rent vs $375k).
- It's been on market 81 days — a 6% lower offer ($352k) is reasonable based on typical stale-listing flexibility.
- Recommended offer: $352k (6.0% below list) — sets the bar for market timing.
- Local home prices are declining (-3.0%/yr); year-one equity from $3k of loan paydown is wiped out by about $11k of value loss. Plan a longer hold.
- Location reads 79/100 on livability (#44 in MA, #2,070 nationally) — a middle-class / working-renter tenant base. Strengths: commute A+, employment A+, health & safety A+; Watch: amenities D+, cost of living F.
- Peabody (suburban): math 29% / reading 40% proficiency, ranked #233 of 302 in MA (top 77%) — families likely to look elsewhere, expect single-tenant / working-renter base with shorter leases.
- Watch-outs: built in 1951 — expect roof / HVAC / electrical / plumbing capex.
- Market conditions: Rents soft (-0.9%/yr); 40 active listings in the ZIP; 5 comparable units currently listed for rent nearby; rentals lingering (median 44d on market — plan ~5-8 weeks vacancy on turnover, expect pricing pressure); 60% of comp listings sitting > 30 days — soft ceiling on asking rent; solid renter incomes; 1,032 units permitted in Essex County in 2024 (590 in 5+ unit buildings).
- Essex County population projected at +15% by 2050 — long-run rental-demand tailwind backs the buy-and-hold thesis.
- 3 sale attempts since 26y ago; this cycle's ask has dropped $75k (17%) from the opening price — seller is motivated, your offer sets the floor, not the list.
- Current owner paid $320k; 17% above their basis — modest negotiation headroom, anchor on the comps not their cost.
- Climate carrying-cost: major wind risk, 72% chance of damaging wind over 30y; extreme-heat days projected 7→15/yr by 2055 (HVAC capex compounding) — expect insurance premiums to compound above CPI over the hold.
- Cap rate 7.9% vs local median 3.4% in Peabody — top-decile yield for the area; either an underpriced asset or a hidden risk that comps aren't pricing in. Stress-test before assuming the spread holds.
- At $3,783/mo this rent would consume 47% of the median local household income ($97k/yr) (locally 2570% of renters already pay >50% of income on rent) — very limited rent-growth headroom before tenants either downsize or default.
Questions for listing agent
- It's been on market 81 days. Have you received any prior offers? Is the seller open to a 6% concession, seller financing, or rate buy-down credit?
- Built in 1951 — when were the roof, HVAC, electrical panel, plumbing, and water heater last replaced?
- Why hasn't it sold? Are there any deal-killer items the seller is aware of (foundation, flood, title, zoning, code violations)?
- Is there a deadline driving the sale (1031 exchange, divorce, estate, relocation)? That informs how much negotiation room exists.
- What's the average days-on-market for RENTAL listings here right now (not sales)? A rising rental-DOM trend means longer vacancies and softer asking-rent achievability than the comps imply.
- What's the recent tenant-quality profile in this submarket — average credit score on applications, eviction rate, late-payment / NSF rate, and stable-employment percentage? A property-management company in the area should have these aggregated.
- How much new for-sale + rental construction is in the pipeline within 1–3 miles? Heavy new supply typically softens prices + rents 12–24 months out; constrained supply supports both.
CashFlowRE · CFR-AVBYAF63TEA8V6
· Data 2 days ago
cashflowre.app · 2026-05-29