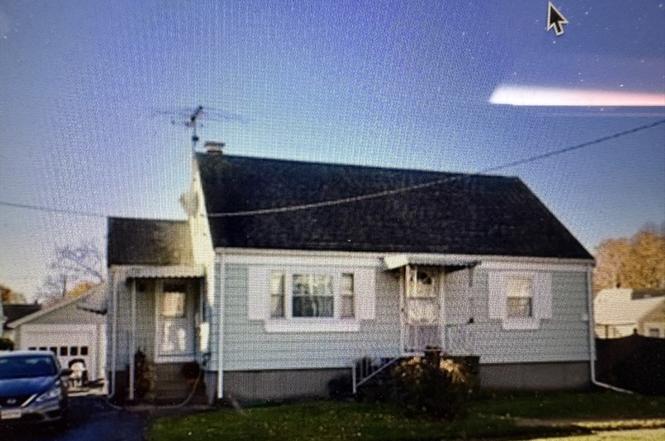
20 Beacon Blvd · Peabody, MA
Flood risk 1/10 · Minimal
- FEMA flood zone
- X (unshaded)
- Chance of flooding over 30 yrs
- 0.0%
- Est. flood insurance / yr
- $473 – $860
Fire risk 1/10 · Minimal
- Est. fire insurance / yr
- $915 – $1,699
Heat risk 5/10 · Moderate
- Hot days now (above 96°F)
- 7 days/yr
- Hot days in 30 yrs
- 15 days/yr
Wind risk 6/10 · Moderate
- Chance of severe wind over 30 yrs
- 72.0%
Air-quality risk 3/10 · Minor
- Unhealthy air days now
- 3 days/yr
- Unhealthy air days in 30 yrs
- 3 days/yr
Risk factors via First Street. Map © Google.
Why this score? — see what drove the C grade
The composite is a weighted blend of 9 inputs, each scored 0–100. Each bar is that input's sub-score; the figure is the points it added to the 100-point composite (weight × sub-score).
- Cash flow +20.6/30.0
- ARV discount +15.0/15.0
- DSCR +6.5/10.0
- 1% rule +5.1/10.0
- Livability +4.0/5.0
- Schools +3.1/10.0
- Condition / age +2.5/5.0
- Rent growth +2.3/5.0
- Appreciation +0.0/10.0
$374,900
🖨 Deal sheet 📄 Offer letter ✓ Due diligence
Listing remarks MLS
OH SUNDAY 10/5 FROM 1-3PM. 3-4 BEDROOM CAPE ON SIDE STREET 2 CAR DETACHED GARAGE, HARDWOOD FLOORS, NAT WOODWORK. 2ND BEDROOMS RECENTLY RENOVATED.OUTSIDE HAS RECENTLY BEEN PAINTED. MUST SEE. SHOWS GREAT!!!! WON'T LAST!
Key facts
- Dead end street
- Driveway parking
- Detached garage
Tags
Property features AI
Finance
- HOA & community: Not a senior community
Exterior
- Parking: Detached paved parking; 2-car garage; 2 covered parking spaces; 2 open parking spaces; Total 4 parking spaces
- Utilities: Public water; Public sewer
- Home design: Single-family residence; No ADU
- Construction: Built (year source: public records, actual); Conventional (2x4-2x6) construction; Concrete perimeter and block foundation
- Exterior features: Level lot; Public road frontage; Shingle roof; Blue exterior color
Interior
- Bathrooms: One full bathroom
- Heating & cooling: Natural gas heating; Has heating
- Interior features: Six total rooms
Neighborhood map
What this means for you Summary
Snapshot
- This is a 4-bed/1.0-bath single-family listed at $375k.
Deal economics
- At list price, monthly cash flow is $500 ($6k/yr) — positive.
- The deal already cash-flows at list — no discount required.
- Meets the 1% rule at list price ($4k rent vs $375k).
- Recommended offer: $352k (6.0% below list) — sets the bar for market timing.
- Cap rate 7.9% vs local median 3.4% in Peabody — top-decile yield for the area; either an underpriced asset or a hidden risk that comps aren't pricing in. Stress-test before assuming the spread holds.
Location & tenants
- Location reads 79/100 on livability (#44 in MA, #2,070 nationally) — a middle-class / working-renter tenant base. Strengths: commute A+, employment A+, health & safety A+; Watch: amenities D+, cost of living F.
- Peabody (suburban): math 29% / reading 40% proficiency, ranked #233 of 302 in MA (top 77%) — families likely to look elsewhere, expect single-tenant / working-renter base with shorter leases.
- Market conditions: Rents soft (-0.9%/yr); 40 active listings in the ZIP; 5 comparable units currently listed for rent nearby; rentals lingering (median 44d on market — plan ~5-8 weeks vacancy on turnover, expect pricing pressure); 60% of comp listings sitting > 30 days — soft ceiling on asking rent; solid renter incomes; 1,032 units permitted in Essex County in 2024 (590 in 5+ unit buildings).
- At $3,783/mo this rent would consume 47% of the median local household income ($97k/yr) (locally 2570% of renters already pay >50% of income on rent) — very limited rent-growth headroom before tenants either downsize or default.
Forward outlook
- Local home prices are declining (-3.0%/yr); year-one equity from $3k of loan paydown is wiped out by about $11k of value loss. Plan a longer hold.
- Essex County population projected at +15% by 2050 — long-run rental-demand tailwind backs the buy-and-hold thesis.
Negotiation context
- It's been on market 81 days — a 6% lower offer ($352k) is reasonable based on typical stale-listing flexibility.
- 3 sale attempts since 26y ago; this cycle's ask has dropped $75k (17%) from the opening price — seller is motivated, your offer sets the floor, not the list.
- Current owner paid $320k; 17% above their basis — modest negotiation headroom, anchor on the comps not their cost.
Risks & watch-outs
- Watch-outs: built in 1951 — expect roof / HVAC / electrical / plumbing capex.
- Climate carrying-cost: major wind risk, 72% chance of damaging wind over 30y; extreme-heat days projected 7→15/yr by 2055 (HVAC capex compounding) — expect insurance premiums to compound above CPI over the hold.
Questions for the listing agent
- It's been on market 81 days. Have you received any prior offers? Is the seller open to a 6% concession, seller financing, or rate buy-down credit?
- Built in 1951 — when were the roof, HVAC, electrical panel, plumbing, and water heater last replaced?
- Why hasn't it sold? Are there any deal-killer items the seller is aware of (foundation, flood, title, zoning, code violations)?
- Is there a deadline driving the sale (1031 exchange, divorce, estate, relocation)? That informs how much negotiation room exists.
- What's the average days-on-market for RENTAL listings here right now (not sales)? A rising rental-DOM trend means longer vacancies and softer asking-rent achievability than the comps imply.
- What's the recent tenant-quality profile in this submarket — average credit score on applications, eviction rate, late-payment / NSF rate, and stable-employment percentage? A property-management company in the area should have these aggregated.
- How much new for-sale + rental construction is in the pipeline within 1–3 miles? Heavy new supply typically softens prices + rents 12–24 months out; constrained supply supports both.
Investment metrics
- 1% rule
- 1.01% ✓
- Cap rate
- 7.89%
- Cash-on-cash
- 5.71%
- DSCR
- 1.25
- GRM
- 8.3
CMA / ARV
- ARV (on-the-fly)
- $620,472
- Comps found
- 12
Show comp detail 12 sales within ~0.75 mi
| Address | Dist | Beds/Ba | Sqft | Sold | Price | $/sf | Match |
|---|---|---|---|---|---|---|---|
| 41 Dexter St | 0.17mi | 3/2.0 (-1) | 1,248 (+1%) | 6mo | $635,000 | $509 | 76 |
| 1 Winnegance Ave | 0.14mi | 3/1.0 (-1) | 1,304 (+6%) | 8mo | $513,000 | $393 | 72 |
| 6 Allen Rd | 0.20mi | 3/1.5 (-1) | 1,322 (+7%) | 3mo | $645,000 | $488 | 70 |
| 44 Dexter St | 0.21mi | 3/1.5 (-1) | 1,344 (+9%) | 1mo | $675,000 | $502 | 68 |
| 26 Bartholomew Ter | 0.34mi | 4/2.0 | 1,321 (+7%) | 3mo | $690,000 | $522 | 66 |
| 127 Lynn St | 0.09mi | 3/2.0 (-1) | 1,144 (-7%) | 12mo | $650,000 | $568 | 64 |
| 11 Tuckers Ct | 0.36mi | 3/1.0 (-1) | 1,272 (+3%) | 12mo | $585,000 | $460 | 63 |
| 30 St. Ann's Ave | 0.30mi | 4/2.0 | 1,344 (+9%) | 6mo | $649,900 | $484 | 62 |
| 3 Margaret Rd | 0.39mi | 3/1.5 (-1) | 1,092 (-12%) | 1mo | $585,000 | $536 | 54 |
| 38 Longview Way | 0.44mi | 3/1.0 (-1) | 1,080 (-13%) | 2mo | $600,000 | $556 | 52 |
| 5 Scenic Rd | 0.68mi | 3/1.0 (-1) | 1,274 (+3%) | 9mo | $500,000 | $392 | 51 |
| 1 Mayfair Rd | 0.62mi | 3/1.0 (-1) | 1,312 (+6%) | 12mo | $604,000 | $460 | 45 |
Match score weights: distance 35% · size 25% · config 20% · recency 20%. Top-matched comps best support the ARV.
Projected returns pro-forma
-3.0% appreciation · 0.0% rent growth · sell at horizon
- IRR
- -10.8%
- Equity multiple
- 0.62×
- Total profit
- $-40,011
- Equity at exit
- $55,899
- IRR
- -6.3%
- Equity multiple
- 0.65×
- Total profit
- $-36,721
- Equity at exit
- $32,415
Cash invested: $104,972 (down + closing). Projections, not guarantees.
Landlord ↔ Tenant lean methodology
- Overall (STATE)
- 20 Strongly Tenant-Friendly
- State Massachusetts
- 20 Strongly Tenant-Friendly · D+15
- County
- — inherits STATE
- City
- — inherits STATE
ZIP-level market 01960
- Rents YoY
- -0.9%
- Active inventory
- 40
- Price-to-rent
- 8.3×
Monthly cashflow live
- Estimated rent
- $3,783 high interval (Pro) →
- Mortgage (P&I)
- −$1,966
- Tax from tax record
- −$367 /mo · $4,400/yr
- Insurance
- −$156
- HOA
- −$0
- Vacancy / Maint / Mgmt
- −$794
- Net cashflow
- $500
Break-even live
UW: 25.0% down · 7.5% · 30yr · 1.5% tax · 5.0% vac · 8.0% maint · 8.0% mgmt
Financing live
Cash to close
- Down payment
- $93,725
- Closing costs
- $11,247
- Reserves months
- —
- Total cash needed
- —
Loan-product check · same deal, 3 products live
Conventional
25% down · 7.5% · 30yr
- Down + closing
- —
- Monthly P&I
- —
- Monthly cashflow
- —
- DSCR
- —
- Eligible?
- —
Personal DTI + credit; lowest rate.
DSCR
20% down · 8.5% · 30yr
- Down + closing
- —
- Monthly P&I
- —
- Monthly cashflow
- —
- DSCR
- —
- Eligible?
- —
No personal income docs; deal must DSCR.
Hard money
10% down · 12.0% · 12mo
- Down + closing
- —
- Monthly P&I
- —
- Monthly cashflow
- —
- DSCR
- —
- Eligible?
- —
Short-term bridge; refi at stabilization.
Rent comps 5 comps
| Address | Beds | Baths | Sqft | Rent | $/sqft | DOM | Units | Dist |
|---|---|---|---|---|---|---|---|---|
| 23 Lynn St Peabody, MA | 3.0 | 1.0 | 1200 | $3,850 | $3.21 | 43d | 1 | 0.54mi |
| 118 Foster St Unit 2 Peabody, MA | 3.0 | 1.0 | 1300 | $3,300 | $2.54 | 12d | 1 | 1.24mi |
| 12 Parsons St Unit 2 Peabody, MA | 3.0 | 1.0 | 1500 | $3,000 | $2.00 | 24d | 1 | 1.26mi |
| 30 Clement Ave Unit 2 Peabody, MA | 4.0 | 1.0 | 1100 | $3,700 | $3.36 | 43d | 1 | 1.33mi |
| 3 Verdon St Salem, MA | 3.0 | 1.0 | 1000 | $3,800 | $3.80 | 43d | 1 | 1.37mi |
Listing history 24 events
-
2026-06-18days on market $374,900 Active 81 DOM
-
2026-06-17days on market $374,900 Active 80 DOM
-
2026-06-16days on market $374,900 Active 79 DOM
-
2026-06-15days on market $374,900 Active 78 DOM
-
2026-06-13days on market $374,900 Active 76 DOM
-
2026-06-13days on market $374,900 Active 75 DOM
-
2026-06-09days on market $374,900 Active 72 DOM
-
2026-06-08days on market $374,900 Active 71 DOM
-
2026-06-07days on market $374,900 Active 70 DOM
-
2026-06-04days on market $374,900 Active 67 DOM
-
2026-06-03days on market $374,900 Active 66 DOM
-
2026-06-02days on market $374,900 Active 65 DOM
-
2026-06-01statusdays on market $374,900 Active 64 DOM
-
2026-05-31days on market $374,900 Price Changed 63 DOM
-
2026-05-05status Under Agreement
-
2026-04-21historical Contingent
-
2026-03-06$449,950 New
-
2004-02-27soldstatus $320,000 217-char remark
Show marketing remark (217 chars)
OH SUNDAY 10/5 FROM 1-3PM. 3-4 BEDROOM CAPE ON SIDE STREET 2 CAR DETACHED GARAGE, HARDWOOD FLOORS, NAT WOODWORK. 2ND BEDROOMS RECENTLY RENOVATED.OUTSIDE HAS RECENTLY BEEN PAINTED. MUST SEE. SHOWS GREAT!!!! WON'T LAST!
-
2004-01-10historical 217-char remark
Show marketing remark (217 chars)
OH SUNDAY 10/5 FROM 1-3PM. 3-4 BEDROOM CAPE ON SIDE STREET 2 CAR DETACHED GARAGE, HARDWOOD FLOORS, NAT WOODWORK. 2ND BEDROOMS RECENTLY RENOVATED.OUTSIDE HAS RECENTLY BEEN PAINTED. MUST SEE. SHOWS GREAT!!!! WON'T LAST!
-
2003-09-24$329,900 217-char remark
Show marketing remark (217 chars)
OH SUNDAY 10/5 FROM 1-3PM. 3-4 BEDROOM CAPE ON SIDE STREET 2 CAR DETACHED GARAGE, HARDWOOD FLOORS, NAT WOODWORK. 2ND BEDROOMS RECENTLY RENOVATED.OUTSIDE HAS RECENTLY BEEN PAINTED. MUST SEE. SHOWS GREAT!!!! WON'T LAST!
-
2000-05-05soldstatus $194,000 190-char remark
Show marketing remark (190 chars)
3-4 BEDROOM CAPE LOCATED ON SIDE STREET. 2-CAR DETACHED GARAGE, HARDWOOD FLOORS,NATURAL WOODWORK. HOUSE NEEDS WORK AND IS SOLD AS IS. LOTS OF POTENTIAL. BUYER IS ALLOWED HOME INSPECTION.
-
2000-05-05soldstatus $194,000
Show marketing remark (190 chars)
3-4 BEDROOM CAPE LOCATED ON SIDE STREET. 2-CAR DETACHED GARAGE, HARDWOOD FLOORS,NATURAL WOODWORK. HOUSE NEEDS WORK AND IS SOLD AS IS. LOTS OF POTENTIAL. BUYER IS ALLOWED HOME INSPECTION.
-
2000-04-20historical 190-char remark
Show marketing remark (190 chars)
3-4 BEDROOM CAPE LOCATED ON SIDE STREET. 2-CAR DETACHED GARAGE, HARDWOOD FLOORS,NATURAL WOODWORK. HOUSE NEEDS WORK AND IS SOLD AS IS. LOTS OF POTENTIAL. BUYER IS ALLOWED HOME INSPECTION.
-
2000-03-03$209,900 190-char remark
Show marketing remark (190 chars)
3-4 BEDROOM CAPE LOCATED ON SIDE STREET. 2-CAR DETACHED GARAGE, HARDWOOD FLOORS,NATURAL WOODWORK. HOUSE NEEDS WORK AND IS SOLD AS IS. LOTS OF POTENTIAL. BUYER IS ALLOWED HOME INSPECTION.
ⓘ Source: listings_history table (triggers on properties + properties_extension) + one-shot
backfill from property_details.listing_events for pre-trigger history.
Tax reassessment forecast MA · Partial reset (capped growth)
- Current annual tax
- $4,400 · $367/mo
- Projected year-2 tax
- $4,506 · $375/mo
- Expected delta
- +$106/yr (+$9/mo · 2.4%)
ⓘ Screening estimate from a state-policy table — verify with the county assessor before closing.
Climate risk First Street
- Flood 1/10 Low FEMA zone X (unshaded) · 0% chance over 30 yrs
- Wildfire 1/10 Low
- Heat 5/10 Major 7 d/yr ≥96°F today · 15 d/yr by 30 yrs out
- Wind 6/10 Major 72% chance of damaging wind over 30 yrs
- Air quality 3/10 Moderate 3 unhealthy d/yr today · 3 by 30 yrs out
Nearby sold comps map
Loading sold comps map…
Walkable amenities ~0.75 mi
Loading nearby amenities…
Taxation est. · year 1
- Rental income
- $45,398
- − Mortgage interest
- −$21,000
- − Property taxes
- −$4,400
- − Insurance
- −$1,874
- − Repairs & maintenance
- −$3,632
- − Management
- −$3,632
- − Depreciation
- −$10,906
- Taxable loss
- −$47
- Est. tax savings @ 24.0%
- +$11
- After-tax cash flow
- $6,009/yr
For passive investors: Depreciation is non-cash, so a rental often shows a tax loss while cash-flowing — sheltering income. Rental losses are passive: they offset passive income freely, and up to $25,000/yr can offset ordinary (W-2) income if you actively participate and your MAGI is under $100k (phasing out to $0 by $150k); unused losses carry forward. On sale, claimed depreciation is recaptured at up to 25%, and gains may owe capital-gains tax (a 1031 exchange can defer both). Figures are a year-1 estimate at your 24.0% rate — not tax advice; consult a CPA.
Schools (NCES district)
- District
- Peabody
- NCES district ID
- 2509360
- Math proficiency
- 29% ▼ -13.00%
- Reading proficiency
- 40% ▼ -5.00%
- Median HH income
- $64,022
- Composite
- 31.23/100
- National rank
- #6033
- State rank
- #233 of 302 in MA
Livability — Peabody
- Score
- 79/100
- State rank
- #44
- US rank
- #2070
Category grades
Schools grade is shown separately in the Schools card above.
Census & demographics
- Census place
- Peabody, MA
- County
- Essex County · 632,995 people
- City population
- 54,474
- Metro
- Boston-Cambridge-Newton, MA-NH
- Population (ZIP)
- 54,474
- Household income
- $96,501
- Rent vs Own
- Severe rent burden
- 2570.0
Population outlook (Essex County) Hauer SSP2
- Today (2025)
- 840,920 people
- By 2030
- 872,201 · +3.7%
- By 2040
- 927,918 · +10.3%
- By 2050
- 970,206 · +15.4%
- By 2075
- 1,077,993 · +28.2%
- By 2100
- 1,103,053 · +31.2%
Race, ethnicity, and origin ACS 2023
- Neighborhood character
- Predominantly White (77%)
- Race & ethnicity
- White 77% Hispanic / Latino 12% Two or more races 10% Black 4% Asian 2%
- Hispanic origin (detail)
- Puerto Rican 2% Dominican 6%
- Common ancestry
- Russian 6% Lithuanian 4% Romanian 3%
- Foreign-born
- 17% · Canada, China
- Languages at home
- 76% English-only · Other Indo-European 11% Spanish 8% French/Haitian/Cajun 2%
Political lean MEDSL · Essex
- 2024 margin
- Strong D (+20.3) · D 59.2% · R 38.9% · Other 1.9%
- 2008→2024 swing
- 0.0pp no change · 2008: 20.3pp · 2024: 20.3pp
- All cycles
- 2024: D+20.3 2020: D+29.1 2016: D+22.5 2012: D+16.2 2008: D+20.3
Not yet ingested
- Civics
- —
Market trends
- HPI YoY
- ▼ -565.60%
- Current HPI
- 285.9699
- Rent YoY
- ▼ -0.91%
- Metro
- Boston-Cambridge-Newton, MA-NH
- State GDP YoY
- ▲ 2.28%
- F500 in state
- 38
Industry mix (Fortune 500 HQ in MA)
| Industry | F500 HQs | Revenue |
|---|---|---|
| Technology | 3 | $17B |
|
||
| Insurance | 2 | $84B |
|
||
| Retail | 2 | $76B |
|
||
| Life Sciences | 1 | $43B |
|
||
| Energy Technology | 1 | $31B |
|
||
| Aerospace / Defense | 1 | $18B |
|
||
Price history
+114.4% since first listed10 events — show timeline
- 2026-05-05 Pending — MLS PIN
- 2026-04-21 Contingent — MLS PIN
- 2026-03-06 Listed $449,950 MLS PIN
- 2004-02-27 Sold (MLS) $320,000 MLS PIN
- 2004-01-10 Listing Removed — MLS PIN
- 2003-09-24 Listed $329,900 MLS PIN
- 2000-05-05 Sold (Public Records) $194,000 Public Records
- 2000-05-05 Sold (MLS) $194,000 MLS PIN
- 2000-04-20 Listing Removed — MLS PIN
- 2000-03-03 Listed $209,900 MLS PIN
Property tax history
+4.1%/yrLatest (2023): $4,400 · +6.7% YoY. Source: county tax records.
Cash-flow waterfall
monthlySold comps — $/sqft
last 12 mo · ≤1 miLoading sold comps…