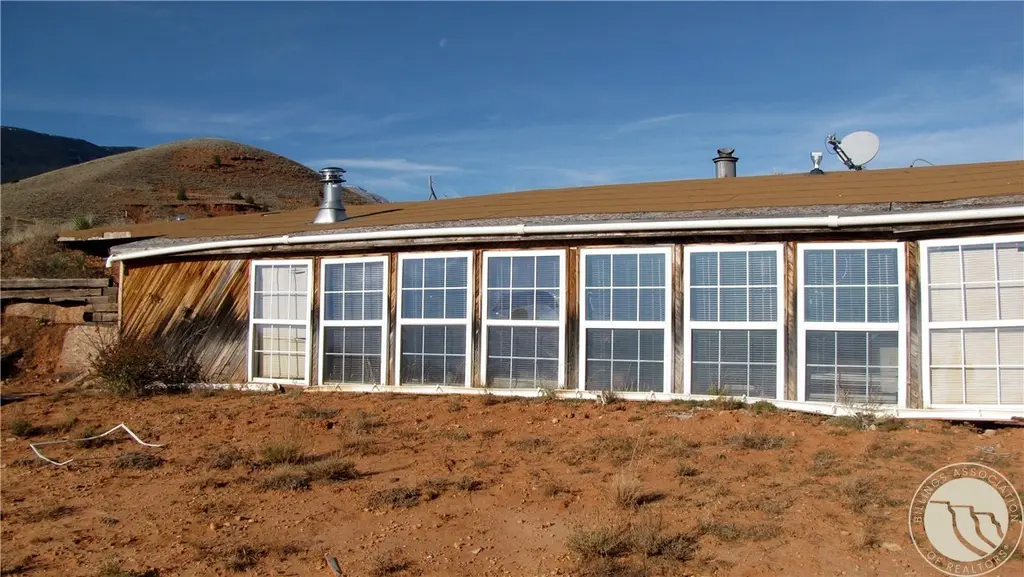
517 Deadman Creek Rd
Bridger, MT 59014
$149,500C-
2 bd · 1.0 ba ·
1,624 sqft ·
Built 2007
· SingleFamily
· Active
· 34 DOM
Cashflow @ list (25.0% down · 7.5%)
Estimated rent
$1,236/mo
Mortgage (P&I)
−$784
Tax + insurance
−$161
HOA
−$0
Vac / Maint / Mgmt
−$260
Net cashflow
$32/mo
Annual
$380/yr
Cap rate
6.55%
Cash-on-cash
0.91%
DSCR
1.04
1% rule
0.83%
Cash to close
$41,860
Investor read
- This is a 2-bed/1.0-bath single-family listed at $150k.
- At list price, monthly cash flow is $32 ($380/yr) — positive.
- The deal already cash-flows at list — no discount required.
- To meet the 1% rule (rent ≥ 1% of price), the offer needs to be $124k (17.3% below list).
- It's been on market 34 days — a 3% lower offer ($145k) is reasonable based on typical stale-listing flexibility.
- Recommended offer: $124k (17.3% below list) — sets the bar for 1% rule.
- In year one you build about $14k of equity ($1k loan paydown + $13k appreciation (9.0% local appreciation)).
- Location reads 75/100 on livability (#33 in MT, #4,211 nationally) — a middle-class / working-renter tenant base. Strengths: crime A+, cost of living A+, housing A+; Watch: amenities F, commute F, employment F.
- Bridger K-12 Schools (rural): math 35% / reading 40% proficiency, ranked #162 of 339 in MT (top 48%) — families likely to look elsewhere, expect single-tenant / working-renter base with shorter leases.
- Zoned schools: Bridger Elementary School (math 34% / reading 34%, grade F, #197 of 293 statewide, top 71%, 118 students, 0% FRL); Bridger 7-8 (math 50% / reading 70%, 25 students, 0% FRL); Bridger High School (math 24% / reading 75%, grade D+, #9 of 132 statewide, top 17%, 56 students, 0% FRL) — zoned schools average 0% FRL vs 33% district-wide (33 pts lower); this property's tenant base skews higher-income than the district average.
- Market conditions: 13 active listings in the ZIP; 48 units permitted in Carbon County in 2024 (0 in 5+ unit buildings).
- Carbon County population projected at +14% by 2050 — modest demand growth; plan on rents tracking national, not racing it.
- 2 sale attempts with the ask held roughly flat each time — persistent listings suggest the price (not the market) is what's stuck; bring a comps-based counter.
- At projected returns (9.0% appreciation + 3.0% rent growth), your $42k cash investment doubles in ~3 years — after that, you're playing with house money.
- By year 3, paydown + projected appreciation supports a ~$36k cash-out refi (75% LTV) — recoverable capital for the next deal without selling this one.
- Climate carrying-cost: major wildfire risk — expect insurance premiums to compound above CPI over the hold.
Questions for listing agent
- It's been on market 34 days. Have you received any prior offers? Is the seller open to a 17% concession, seller financing, or rate buy-down credit?
- Is there a deadline driving the sale (1031 exchange, divorce, estate, relocation)? That informs how much negotiation room exists.
- What's the average days-on-market for RENTAL listings here right now (not sales)? A rising rental-DOM trend means longer vacancies and softer asking-rent achievability than the comps imply.
- What's the recent tenant-quality profile in this submarket — average credit score on applications, eviction rate, late-payment / NSF rate, and stable-employment percentage? A property-management company in the area should have these aggregated.
- How much new for-sale + rental construction is in the pipeline within 1–3 miles? Heavy new supply typically softens prices + rents 12–24 months out; constrained supply supports both.
CashFlowRE · CFR-AVE2DBB7VJPNAB
· Data 2 days ago
cashflowre.app · 2026-05-29