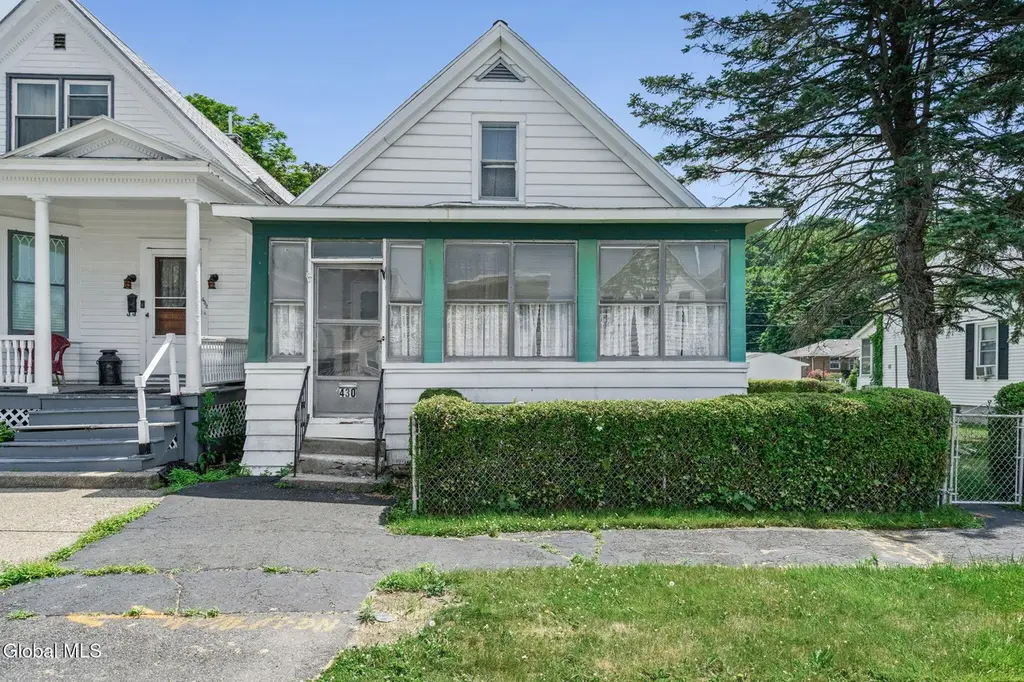
430 8th Ave
Troy, NY 12182
$219,000D-
3 bd · 1.0 ba ·
1,817 sqft ·
Built 1925
· SingleFamily
· Active
· 5 DOM
Cashflow @ list (25.0% down · 7.5%)
Estimated rent
$2,044/mo
Mortgage (P&I)
−$1,148
Tax + insurance
−$862
HOA
−$0
Vac / Maint / Mgmt
−$429
Net cashflow
$-396/mo
Annual
$-4,747/yr
Cap rate
4.13%
Cash-on-cash
-7.74%
DSCR
0.66
1% rule
0.93%
Cash to close
$61,320
Investor read
- This is a 3-bed/1.0-bath single-family listed at $219k.
- At list price, monthly cash flow is $-396 ($-5k/yr) — negative.
- To cash-flow at today's rent, offer at most $185k (15.6% below list).
- To meet the 1% rule (rent ≥ 1% of price), the offer needs to be $204k (6.7% below list).
- Only 5 days on market — expect competitive offers; lowballing is unlikely to land.
- Recommended offer: $185k (15.6% below list) — sets the bar for cash-flow.
- Local home prices are declining (-3.0%/yr); year-one equity from $2k of loan paydown is wiped out by about $7k of value loss. Plan a longer hold.
- Location reads 81/100 on livability (#88 in NY, #1,350 nationally) — a professional / high-income tenant draw. Strengths: amenities A+, commute A+, housing A+; Watch: employment C-, crime F.
- Lansingburgh Central School District (urban): math 31% / reading 35% proficiency, ranked #566 of 590 in NY (top 96%) — families likely to look elsewhere, expect single-tenant / working-renter base with shorter leases.
- Zoned schools: Turnpike Elementary School (534 students, 61% FRL); Knickerbacker Middle School (math 15% / reading 35%, grade F, #601 of 729 statewide, top 82%, 471 students, 75% FRL); Lansingburgh Senior High School (math 92%, 638 students, 75% FRL) — zoned schools average 70% FRL vs 51% district-wide (19 pts higher); higher-poverty schools than district average — tighter screening recommended.
- Watch-outs: property tax is 4.2% of price; built in 1925 — expect roof / HVAC / electrical / plumbing capex.
- Market conditions: 76 active listings in the ZIP; 11 comparable units currently listed for rent nearby; rentals at typical pace (median 17d on market — plan ~3-4 weeks tenant-placement turnaround); 405 units permitted in Rensselaer County in 2024 (224 in 5+ unit buildings).
- Rensselaer County population projected to shrink 6% by 2050 — rents likely to lag national; underwrite the cash flow, not the appreciation.
- Current owner paid $120k; list at $219k implies a 82% gain — meaningful room to come down on a strong offer.
- Cap rate 4.1% vs local median 5.3% in Troy — below-typical yield; the buyer is paying a premium for something (appreciation thesis, condition, location) that the cap rate doesn't capture.
Questions for listing agent
- What do current leases actually rent for vs. the listed asking? Can we see a recent rent roll and the last 12 months of T-12 income?
- Built in 1925 — when were the roof, HVAC, electrical panel, plumbing, and water heater last replaced?
- Property tax is high relative to price — has the assessment been appealed recently, and will the sale trigger a re-assessment?
- Is there a deadline driving the sale (1031 exchange, divorce, estate, relocation)? That informs how much negotiation room exists.
- Crime grade is F in this area — have there been break-ins, vandalism, or insurance claims at this property in the last 3 years? What carrier currently insures it and at what premium?
- The area grade is low — what's the realistic commute time and amenity access for the typical tenant pool here? Any planned neighborhood developments (good or bad) we should know about?
- What's the average days-on-market for RENTAL listings here right now (not sales)? A rising rental-DOM trend means longer vacancies and softer asking-rent achievability than the comps imply.
- What's the recent tenant-quality profile in this submarket — average credit score on applications, eviction rate, late-payment / NSF rate, and stable-employment percentage? A property-management company in the area should have these aggregated.
CashFlowRE · CFR-AVV5N33FVQB38K
· Data 20 h ago
cashflowre.app · 2026-05-29