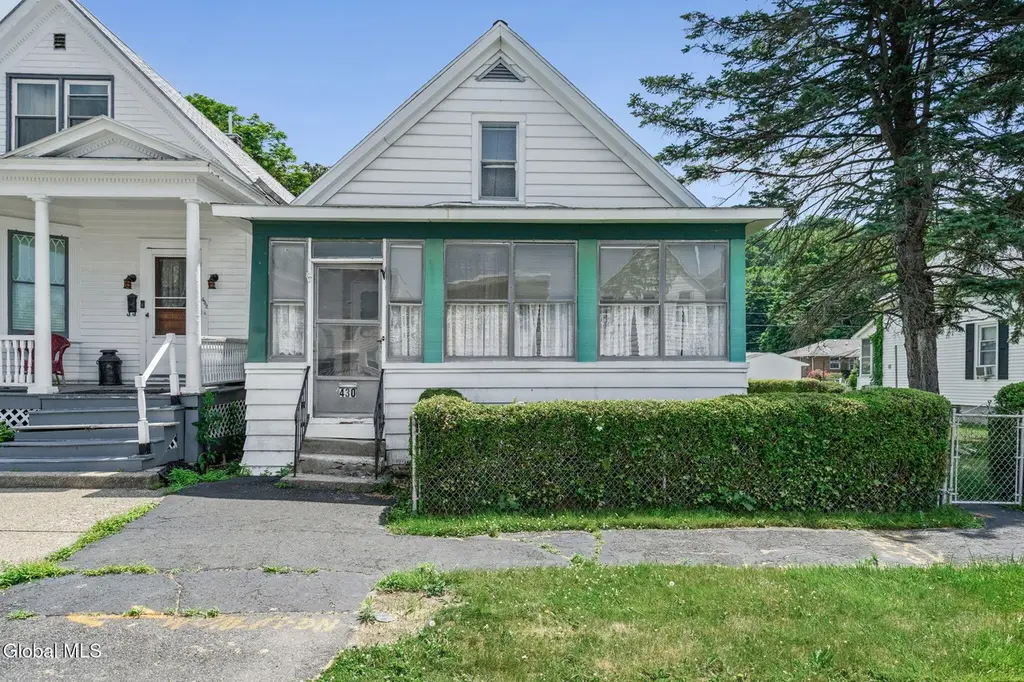
430 8th Ave · Troy, NY
Flood risk 1/10 · Minimal
- FEMA flood zone
- X
- Chance of flooding over 30 yrs
- 0.0%
- Est. flood insurance / yr
- $473 – $860
Fire risk 3/10 · Minor
- Est. fire insurance / yr
- $691 – $1,283
Heat risk 4/10 · Minor
- Hot days now (above 95°F)
- 8 days/yr
- Hot days in 30 yrs
- 18 days/yr
Wind risk 3/10 · Minor
- Chance of severe wind over 30 yrs
- 6.0%
Air-quality risk 2/10 · Minimal
- Unhealthy air days now
- 0 days/yr
- Unhealthy air days in 30 yrs
- 1 days/yr
Risk factors via First Street. Map © Google.
Why this score? — see what drove the D- grade
The composite is a weighted blend of 9 inputs, each scored 0–100. Each bar is that input's sub-score; the figure is the points it added to the 100-point composite (weight × sub-score).
- ARV discount +14.6/15.0
- Cash flow +6.2/30.0
- 1% rule +4.3/10.0
- Livability +4.0/5.0
- Schools +2.8/10.0
- Rent growth +2.5/5.0
- Condition / age +2.5/5.0
- DSCR +0.6/10.0
- Appreciation +0.0/10.0
$219,000
🖨 Deal sheet (PDF) 📄 Offer letter ✓ Due diligence
Listing remarks
Welcome to 430 8th Avenue in Troy! Proudly owned and lovingly maintained by the same family for over 60 years, this charming 3-bedroom, 1-bath home is ready for its next chapter. Situated on a rare double lot, the property offers an abundance of outdoor space with endless possibilities for gardening, recreation, entertaining, or future expansion. Inside, you'll find a comfortable layout along with a bonus finished attic that provides valuable additional living space, perfect for a home office, playroom, guest area, or hobby room. A detached 2-car garage offers plenty of room for parking, storage, or a workshop. Conveniently located within walking distance to Rensselaer Park Elementary Schoo
Key facts
- 7,405 sq ft lot
- 2 garage spots
- Built 1925
Property features AI
Exterior
- Parking: Detached garage; Two garage spaces; Three total parking spaces; Off-street paved parking
- Utilities: 150 amp electric service; Public water; Public sewer
- Home design: Single family residence; Living area approximately 1,817
- Construction: Aluminum siding; Block, combination, and stone foundation; Asphalt roof; Built prior to present (year not specified)
- Exterior features: Front and rear porches; Patio; Paved driveway; Backyard and perimeter fencing; Garages/garage structure
Interior
- Kitchen: Oven; Range; Refrigerator
- Bedrooms: Three bedrooms on the first floor; One additional room (other) on the second floor
- Flooring: Tile; Wood; Hardwood; Laminate
- Bathrooms: One full bathroom on the first floor
- Heating & cooling: Hot water heating (natural gas); Window air conditioning units
- Interior features: Seven total rooms; Full basement
- Laundry & utility: Washer and dryer included; Laundry located on the main level
Neighborhood map
What this means for you Summary
Snapshot
- This is a 3-bed/1.0-bath single-family listed at $219k.
Deal economics
- At list price, monthly cash flow is $-396 ($-5k/yr) — negative.
- To cash-flow at today's rent, offer at most $185k (15.6% below list).
- To meet the 1% rule (rent ≥ 1% of price), the offer needs to be $204k (6.7% below list).
- Recommended offer: $185k (15.6% below list) — sets the bar for cash-flow.
- Cap rate 4.1% vs local median 5.3% in Troy — below-typical yield; the buyer is paying a premium for something (appreciation thesis, condition, location) that the cap rate doesn't capture.
Location & tenants
- Location reads 81/100 on livability (#88 in NY, #1,350 nationally) — a professional / high-income tenant draw. Strengths: amenities A+, commute A+, housing A+; Watch: employment C-, crime F.
- Lansingburgh Central School District (urban): math 31% / reading 35% proficiency, ranked #566 of 590 in NY (top 96%) — families likely to look elsewhere, expect single-tenant / working-renter base with shorter leases.
- Zoned schools: Turnpike Elementary School (534 students, 61% FRL); Knickerbacker Middle School (math 15% / reading 35%, grade F, #601 of 729 statewide, top 82%, 471 students, 75% FRL); Lansingburgh Senior High School (math 92%, 638 students, 75% FRL) — zoned schools average 70% FRL vs 51% district-wide (19 pts higher); higher-poverty schools than district average — tighter screening recommended.
- Market conditions: 76 active listings in the ZIP; 11 comparable units currently listed for rent nearby; rentals at typical pace (median 16d on market — plan ~3-4 weeks tenant-placement turnaround); 405 units permitted in Rensselaer County in 2024 (224 in 5+ unit buildings).
Forward outlook
- Local home prices are declining (-3.0%/yr); year-one equity from $2k of loan paydown is wiped out by about $7k of value loss. Plan a longer hold.
- Rensselaer County population projected to shrink 6% by 2050 — rents likely to lag national; underwrite the cash flow, not the appreciation.
Negotiation context
- Only 5 days on market — expect competitive offers; lowballing is unlikely to land.
- Current owner paid $120k; list at $219k implies a 82% gain — meaningful room to come down on a strong offer.
Risks & watch-outs
- Watch-outs: property tax is 4.2% of price; built in 1925 — expect roof / HVAC / electrical / plumbing capex.
Questions for the listing agent
- What do current leases actually rent for vs. the listed asking? Can we see a recent rent roll and the last 12 months of T-12 income?
- Built in 1925 — when were the roof, HVAC, electrical panel, plumbing, and water heater last replaced?
- Property tax is high relative to price — has the assessment been appealed recently, and will the sale trigger a re-assessment?
- Is there a deadline driving the sale (1031 exchange, divorce, estate, relocation)? That informs how much negotiation room exists.
- Crime grade is F in this area — have there been break-ins, vandalism, or insurance claims at this property in the last 3 years? What carrier currently insures it and at what premium?
- The area grade is low — what's the realistic commute time and amenity access for the typical tenant pool here? Any planned neighborhood developments (good or bad) we should know about?
- What's the average days-on-market for RENTAL listings here right now (not sales)? A rising rental-DOM trend means longer vacancies and softer asking-rent achievability than the comps imply.
- What's the recent tenant-quality profile in this submarket — average credit score on applications, eviction rate, late-payment / NSF rate, and stable-employment percentage? A property-management company in the area should have these aggregated.
- How much new for-sale + rental construction is in the pipeline within 1–3 miles? Heavy new supply typically softens prices + rents 12–24 months out; constrained supply supports both.
Investment metrics
- 1% rule
- 0.93% ✗
- Cap rate
- 4.13%
- Cash-on-cash
- -7.74%
- DSCR
- 0.66
- GRM
- 8.9
CMA / ARV
- ARV (on-the-fly)
- $259,831
- Comps found
- 12
Show comp detail 12 sales within ~0.75 mi
| Address | Dist | Beds/Ba | Sqft | Sold | Price | $/sf | Match |
|---|---|---|---|---|---|---|---|
| 426 8th Ave | 0.01mi | 3/2.0 | 1,872 (+3%) | 12mo | $240,000 | $128 | 81 |
| 463 8th Ave | 0.10mi | 3/2.0 | 1,873 (+3%) | 19mo | $195,000 | $104 | 71 |
| 226 6th Ave | 0.58mi | 3/1.5 | 1,878 (+3%) | 3mo | $214,000 | $114 | 63 |
| 562 3rd Ave | 0.48mi | 3/2.0 | 1,920 (+6%) | 5mo | $295,000 | $154 | 60 |
| 302 6th Ave | 0.37mi | 3/1.5 | 1,725 (-5%) | 16mo | $255,000 | $148 | 59 |
| 25 111th St | 0.25mi | 4/2.0 (+1) | 1,596 (-12%) | 2mo | $230,500 | $144 | 57 |
| 415 6th Ave | 0.16mi | 4/2.0 (+1) | 1,620 (-11%) | 13mo | $260,000 | $160 | 54 |
| 22 115th St | 0.47mi | 3/2.0 | 1,655 (-9%) | 9mo | $225,000 | $136 | 51 |
| 660 5th Ave | 0.66mi | 2/1.0 (-1) | 1,750 (-4%) | 12mo | $250,000 | $143 | 48 |
| 594 3rd Ave | 0.55mi | 2/1.5 (-1) | 1,852 (+2%) | 20mo | $145,000 | $78 | 47 |
| 592 5th Ave | 0.49mi | 4/2.0 (+1) | 2,044 (+12%) | 5mo | $253,000 | $124 | 43 |
| 476 W Park Pl | 0.33mi | 2/2.5 (-1) | 1,632 (-10%) | 18mo | $280,000 | $172 | 41 |
Match score weights: distance 35% · size 25% · config 20% · recency 20%. Top-matched comps best support the ARV.
Projected returns pro-forma
-3.0% appreciation · 3.0% rent growth · sell at horizon
- IRR
- -29.6%
- Equity multiple
- 0.02×
- Total profit
- $-60,348
- Equity at exit
- $32,654
- IRR
- -29.5%
- Equity multiple
- -0.36×
- Total profit
- $-83,628
- Equity at exit
- $18,935
Cash invested: $61,320 (down + closing). Projections, not guarantees.
Landlord ↔ Tenant lean methodology
- Overall (STATE)
- 15 Strongly Tenant-Friendly
- State New York
- 15 Strongly Tenant-Friendly · D+10
- County
- — inherits STATE
- City
- — inherits STATE
ZIP-level market 12182
- Home prices YoY
- -15.6%
- Active inventory
- 76
- Price-to-rent
- 8.9×
Monthly cashflow live
- Estimated rent
- $2,044 high interval (Pro) →
- Mortgage (P&I)
- −$1,148
- Tax from tax record
- −$770 /mo · $9,246/yr
- Insurance
- −$91
- HOA
- −$0
- Vacancy / Maint / Mgmt
- −$429
- Net cashflow
- $-396
Break-even live
Sensitivity live
| Price | -10% $-272 | -5% $-334 | +0% $-396 | +5% $-458 | +10% $-520 |
|---|---|---|---|---|---|
| Rent | -10% $-557 | -5% $-476 | +0% $-396 | +5% $-315 | +10% $-234 |
| Rate | -1.0pp $-285 | -0.5pp $-340 | base $-396 | +0.5pp $-452 | +1.0pp $-510 |
UW: 25.0% down · 7.5% · 30yr · 1.5% tax · 5.0% vac · 8.0% maint · 8.0% mgmt
Financing live
Cash to close
- Down payment
- $54,750
- Closing costs
- $6,570
- Reserves months
- —
- Total cash needed
- —
Loan-product check · same deal, 3 products live
Conventional
25% down · 7.5% · 30yr
- Down + closing
- —
- Monthly P&I
- —
- Monthly cashflow
- —
- DSCR
- —
- Eligible?
- —
Personal DTI + credit; lowest rate.
DSCR
20% down · 8.5% · 30yr
- Down + closing
- —
- Monthly P&I
- —
- Monthly cashflow
- —
- DSCR
- —
- Eligible?
- —
No personal income docs; deal must DSCR.
Hard money
10% down · 12.0% · 12mo
- Down + closing
- —
- Monthly P&I
- —
- Monthly cashflow
- —
- DSCR
- —
- Eligible?
- —
Short-term bridge; refi at stabilization.
Rent comps 11 comps
| Address | Beds | Baths | Sqft | Rent | $/sqft | DOM | Units | Dist |
|---|---|---|---|---|---|---|---|---|
| 290 2nd Ave Troy, NY | 3.0 | 1.0 | 1400 | $1,600 | $1.14 | 23d | 1 | 0.54mi |
| 413 Diamond Rock Cir Troy, NY | 2.0 | 2.0 | 1252 | $2,100 | $1.68 | 21d | 1 | 0.60mi |
| 413 Diamond Rock Cir Troy, NY | 2.0 | 2.0 | 1252 | $2,100 | $1.68 | 16d | 1 | 0.60mi |
| 157 6th Ave Unit 2 Troy, NY | 3.0 | 1.0 | 1300 | $1,350 | $1.04 | 21d | 1 | 0.79mi |
| 131 6th Ave Troy, NY | 4.0 | 1.0 | 1400 | $2,325 | $1.66 | 16d | 1 | 0.85mi |
| 100 Waters View Cir Cohoes, NY | 1.0–2.0 | 1.0–2.5 | 1281 | $2,413 | $1.88 | 16d | 13 | 0.89mi |
| 53 Park Ave Cohoes, NY | 3.0 | 1.0 | 1875 | $1,600 | $0.85 | 16d | 1 | 0.90mi |
| 750 2nd Ave Troy, NY | 1.0–3.0 | 1.0–1.5 | 1185 | $1,711 | $1.44 | 16d | 1 | 0.91mi |
| 11 Parker Ln Unit 5 Waterford, NY | 2.0 | 2.5 | 1500 | $2,800 | $1.87 | 16d | 1 | 1.32mi |
| 192 Saratoga St Cohoes, NY | 1.0–3.0 | 1.0–3.0 | 1157 | $2,600 | $2.25 | 16d | 4 | 1.37mi |
| 12 White St Cohoes, NY | 3.0 | 2.0 | 1790 | $2,895 | $1.62 | 21d | 1 | 1.48mi |
Listing history 4 events
-
2026-06-22days on market $219,000 Active 5 DOM
-
2026-06-18days on market $219,000 Active 2 DOM
-
2026-06-16remarks 699-char remark
-
2026-06-16$219,000 Active 1 DOM
ⓘ Source: listings_history table (triggers on properties + properties_extension) + one-shot
backfill from property_details.listing_events for pre-trigger history.
Tax reassessment forecast NY · Partial reset (capped growth)
- Current annual tax
- $9,246 · $770/mo
- Projected year-2 tax
- $9,246 · $770/mo
- Expected delta
- $0/yr ($0/mo · 0.0%)
ⓘ Screening estimate from a state-policy table — verify with the county assessor before closing.
Climate risk First Street
- Flood 1/10 Low FEMA zone X · 0% chance over 30 yrs
- Wildfire 3/10 Moderate
- Heat 4/10 Moderate 8 d/yr ≥95°F today · 18 d/yr by 30 yrs out
- Wind 3/10 Moderate 6% chance of damaging wind over 30 yrs
- Air quality 2/10 Low 0 unhealthy d/yr today · 1 by 30 yrs out
Nearby sold comps map
Loading sold comps map…
Walkable amenities ~0.75 mi
Loading nearby amenities…
Taxation est. · year 1
- Rental income
- $24,526
- − Mortgage interest
- −$12,267
- − Property taxes
- −$9,246
- − Insurance
- −$1,095
- − Repairs & maintenance
- −$1,962
- − Management
- −$1,962
- − Depreciation
- −$6,371
- Taxable loss
- −$8,378
- Est. tax savings @ 24.0%
- +$2,011
- After-tax cash flow
- $-2,737/yr
For passive investors: Depreciation is non-cash, so a rental often shows a tax loss while cash-flowing — sheltering income. Rental losses are passive: they offset passive income freely, and up to $25,000/yr can offset ordinary (W-2) income if you actively participate and your MAGI is under $100k (phasing out to $0 by $150k); unused losses carry forward. On sale, claimed depreciation is recaptured at up to 25%, and gains may owe capital-gains tax (a 1031 exchange can defer both). Figures are a year-1 estimate at your 24.0% rate — not tax advice; consult a CPA.
Schools (NCES district)
- District
- Lansingburgh Central School District
- NCES district ID
- 3616740
- Math proficiency
- 31% ▼ -7.00%
- Reading proficiency
- 35% ▼ -6.00%
- Median HH income
- $44,807
- Composite
- 28.19/100
- National rank
- #6810
- State rank
- #566 of 590 in NY
Livability — Troy
- Score
- 81/100
- State rank
- #88
- US rank
- #1350
Category grades
Schools grade is shown separately in the Schools card above.
Census & demographics
- Census place
- Troy, NY
- City population
- 53,479
- Population (ZIP)
- 14,273
Population outlook (Rensselaer County) Hauer SSP2
- Today (2025)
- 162,400 people
- By 2030
- 161,746 · -0.4%
- By 2040
- 158,095 · -2.7%
- By 2050
- 152,966 · -5.8%
- By 2075
- 140,767 · -13.3%
- By 2100
- 124,727 · -23.2%
Race, ethnicity, and origin ACS 2023
- Neighborhood character
- Predominantly White (70%)
- Race & ethnicity
- White 70% Black 14% Two or more races 12% Hispanic / Latino 7%
- Hispanic origin (detail)
- Puerto Rican 6%
- Common ancestry
- Lithuanian 7% Romanian 3% Iranian 1%
- Foreign-born
- 3% · Canada, Jamaica
- Languages at home
- 94% English-only · Spanish 4% Other Indo-European 1%
Political lean MEDSL · Rensselaer
- 2024 margin
- Toss-up / Even · D 50.7% · R 49.3%
- 2008→2024 swing
- -8.0pp toward R · 2008: 9.3pp · 2024: 1.4pp
- All cycles
- 2024: D+1.4 2020: D+5.6 2016: R+2.9 2012: D+11.8 2008: D+9.3
Not yet ingested
- Civics
- —
Market trends
- HPI YoY
- ▼ -50.58%
- Current HPI
- 273.5758
- Rent YoY
- —
- Metro
- —
- State GDP YoY
- ▲ 2.60%
- F500 in state
- 92
Industry mix (Fortune 500 HQ in NY)
| Industry | F500 HQs | Revenue |
|---|---|---|
| Financial Services | 10 | $950B |
|
||
| Consumer Goods | 9 | $162B |
|
||
| Insurance | 4 | $225B |
|
||
| Telecommunications | 2 | $144B |
|
||
| Pharmaceuticals | 2 | $112B |
|
||
| Media / Entertainment | 2 | $69B |
|
||
Price history
+82.5% since first listed2 events — show timeline
- 2026-06-15 Listed $219,000 Global MLS
- 2009-09-23 Sold (Public Records) $120,000 Public Records
Property tax history
+10.8%/yrLatest (2025): $9,246 · +1.6% YoY. Source: county tax records.
Cash-flow waterfall
monthlySold comps — $/sqft
last 12 mo · ≤1 miLoading sold comps…