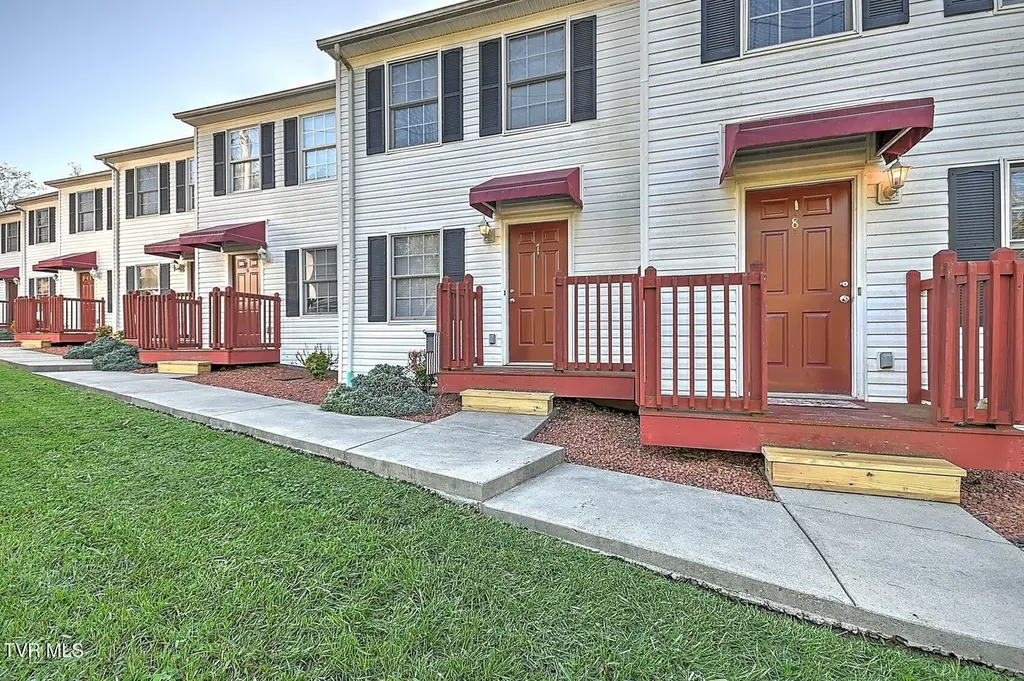
801 Magnolia Ext #3
Johnson City, TN 37604
$1,600D+
2 bd · 2.0 ba ·
1,088 sqft ·
Built 2008
· SingleFamily
· Active
· 40 DOM
Cashflow @ list (25.0% down · 7.5%)
Estimated rent
$1,305/mo
Mortgage (P&I)
−$8
Tax + insurance
−$3
HOA
−$0
Vac / Maint / Mgmt
−$274
Net cashflow
$1,020/mo
Annual
$12,237/yr
Cap rate
771.08%
Cash-on-cash
2731.37%
DSCR
122.53
1% rule
81.55%
Cash to close
$448
Investor read
- This is a 2-bed/2.0-bath single-family listed at $2k.
- At list price, monthly cash flow is $1k ($12k/yr) — positive.
- The deal already cash-flows at list — no discount required.
- Meets the 1% rule at list price ($1k rent vs $2k).
- It's been on market 40 days — a 3% lower offer ($2k) is reasonable based on typical stale-listing flexibility.
- Recommended offer: $2k (3.0% below list) — sets the bar for market timing.
- Local home prices are declining (-3.0%/yr); year-one equity from $11 of loan paydown is wiped out by about $48 of value loss. Plan a longer hold.
- Location reads 76/100 on livability (#8 in TN, #3,349 nationally) — a middle-class / working-renter tenant base. Strengths: amenities A+, cost of living A+, health & safety A; Watch: crime D, commute F, employment F.
- Johnson City (urban): math 46% / reading 47% proficiency, ranked #9 of 139 in TN (top 6%) — families likely to look elsewhere, expect single-tenant / working-renter base with shorter leases.
- Zoned schools: South Side Elementary (math 42% / reading 57%, grade D, #119 of 952 statewide, top 14%, 407 students, 0% FRL); Liberty Bell Middle School (math 43% / reading 38%, grade F, #42 of 333 statewide, top 13%, 898 students, 0% FRL); Science Hill High School (math 37% / reading 60%, grade D, #13 of 332 statewide, top 4%, 2,401 students, 0% FRL) — zoned schools average 0% FRL vs 44% district-wide (44 pts lower); this property's tenant base skews higher-income than the district average.
- Market conditions: Rents rising (+1.5%/yr); 207 active listings in the ZIP; 28 comparable units currently listed for rent nearby; rentals at typical pace (median 21d on market — plan ~3-4 weeks tenant-placement turnaround); 1,155 units permitted in Washington County in 2024 (437 in 5+ unit buildings).
- Washington County population projected at +9% by 2050 — modest demand growth; plan on rents tracking national, not racing it.
- At projected returns (-3.0% appreciation + 1.5% rent growth), your $448 cash investment doubles in ~1 year — after that, you're playing with house money.
- Cap rate 771.1% vs local median 3.1% in Johnson City — top-decile yield for the area; either an underpriced asset or a hidden risk that comps aren't pricing in. Stress-test before assuming the spread holds.
Questions for listing agent
- It's been on market 40 days. Have you received any prior offers? Is the seller open to a 3% concession, seller financing, or rate buy-down credit?
- Is there a deadline driving the sale (1031 exchange, divorce, estate, relocation)? That informs how much negotiation room exists.
- Crime grade is D in this area — have there been break-ins, vandalism, or insurance claims at this property in the last 3 years? What carrier currently insures it and at what premium?
- The area grade is low — what's the realistic commute time and amenity access for the typical tenant pool here? Any planned neighborhood developments (good or bad) we should know about?
- What's the average days-on-market for RENTAL listings here right now (not sales)? A rising rental-DOM trend means longer vacancies and softer asking-rent achievability than the comps imply.
- What's the recent tenant-quality profile in this submarket — average credit score on applications, eviction rate, late-payment / NSF rate, and stable-employment percentage? A property-management company in the area should have these aggregated.
- How much new for-sale + rental construction is in the pipeline within 1–3 miles? Heavy new supply typically softens prices + rents 12–24 months out; constrained supply supports both.
CashFlowRE · CFR-AX14TACNMNVF1S
· Data 4 days ago
cashflowre.app · 2026-05-29