 🏷️ Likely Rental
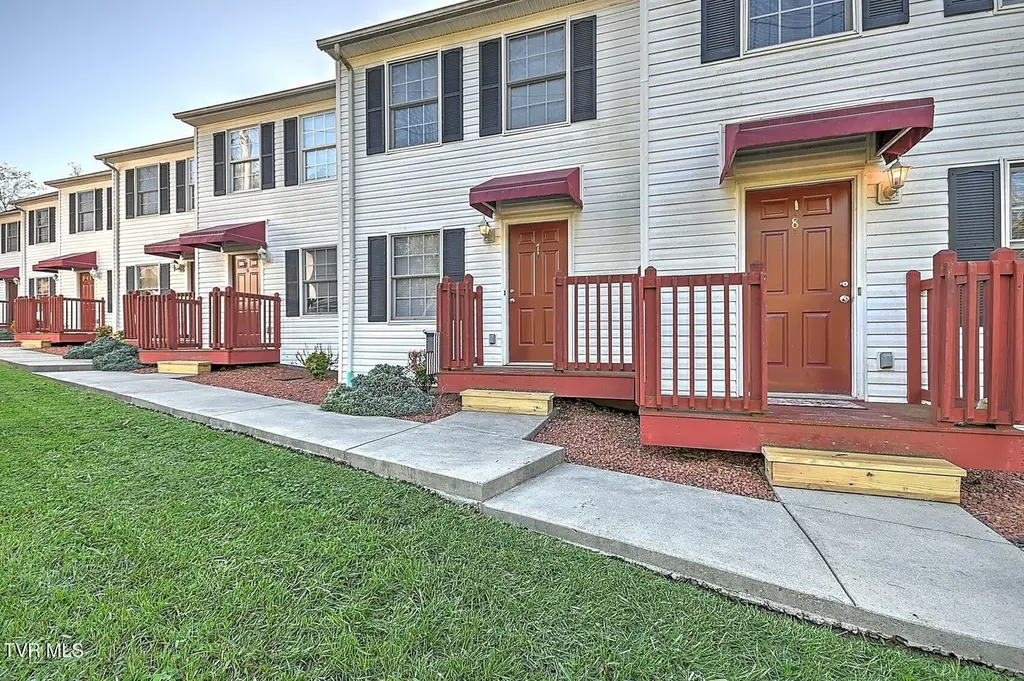
801 Magnolia Ext #3 · Johnson City, TN
Flood risk 1/10 · Minimal
- FEMA flood zone
- X (unshaded)
- Chance of flooding over 30 yrs
- 0.0%
- Est. flood insurance / yr
- $507 – $1,088
Fire risk 3/10 · Minor
- Est. fire insurance / yr
- $949 – $1,763
Heat risk 4/10 · Minor
- Hot days now (above 95°F)
- 6 days/yr
- Hot days in 30 yrs
- 18 days/yr
Wind risk 2/10 · Minimal
- Chance of severe wind over 30 yrs
- —
Air-quality risk 2/10 · Minimal
- Unhealthy air days now
- 1 days/yr
- Unhealthy air days in 30 yrs
- 1 days/yr
Risk factors via First Street. Map © Google.
Why this score? — see what drove the D+ grade
The composite is a weighted blend of 9 inputs, each scored 0–100. Each bar is that input's sub-score; the figure is the points it added to the 100-point composite (weight × sub-score).
- Cash flow +15.0/30.0
- ARV discount +7.5/15.0
- 1% rule +5.0/10.0
- DSCR +5.0/10.0
- Schools +3.9/10.0
- Livability +3.8/5.0
- Rent growth +2.9/5.0
- Condition / age +2.5/5.0
- Appreciation +0.0/10.0
$1,600
🖨 Deal sheet 📄 Offer letter ✓ Due diligence
Listing remarks
2-Bedroom, 2-Bathroom Townhome with Garage and Loft Near ETSU Located just 4 minutes from ETSU, this 2-bedroom, 2-bathroom townhome features an open-concept kitchen and living room on the main floor. Upstairs, there are two bedrooms, two bathrooms, and a loft area that serves as additional living space. The property includes a one-car garage with storage space in the back. Washer and dryer hookups are located in the garage. Lawn maintenance is provided by the landlord. Please note: The photos in this listing show the property furnished, but the home is being rented unfurnished. This home is currently occupied and will be available for move-in on June 1. Showings require 24 hours' notice.
Key facts
- One-car garage
- Open-concept kitchen
- Lawn maintenance
Tags
Property features AI
Exterior
- Parking: 1-car garage; Asphalt parking
- Security: Carbon monoxide detector(s); Smoke detector(s)
- Utilities: Public water; Public sewer; Electricity connected; Cable available; Phone available; Water connected; Sewer connected
- Home design: Townhouse; Two levels; Residential property
- Construction: Vinyl siding
- Exterior features: Covered patio/porch; Deck; Front porch; Shingle roof; Sloped, wooded topography
Interior
- Kitchen: Dishwasher; Electric range; Refrigerator
- Bedrooms: Total rooms: 9
- Bathrooms: 2 full bathrooms
- Heating & cooling: Central heating; Electric heating; Heat pump; Central air; Ceiling fans
- Interior features: Eat-in kitchen; Laminate countertops; Open floorplan; Double pane windows
- Laundry & utility: Washer hookup; Electric dryer hookup
Neighborhood map
What this means for you Summary
Snapshot
- This is a 2-bed/2.0-bath single-family listed at $2k.
Deal economics
- At list price, monthly cash flow is $1k ($12k/yr) — positive.
- The deal already cash-flows at list — no discount required.
- Meets the 1% rule at list price ($1k rent vs $2k).
- Recommended offer: $2k (3.0% below list) — sets the bar for market timing.
- Cap rate 771.1% vs local median 3.1% in Johnson City — top-decile yield for the area; either an underpriced asset or a hidden risk that comps aren't pricing in. Stress-test before assuming the spread holds.
Location & tenants
- Location reads 76/100 on livability (#8 in TN, #3,349 nationally) — a middle-class / working-renter tenant base. Strengths: amenities A+, cost of living A+, health & safety A; Watch: crime D, commute F, employment F.
- Johnson City (urban): math 46% / reading 47% proficiency, ranked #9 of 139 in TN (top 6%) — families likely to look elsewhere, expect single-tenant / working-renter base with shorter leases.
- Zoned schools: South Side Elementary (math 42% / reading 57%, grade D, #119 of 952 statewide, top 14%, 407 students, 0% FRL); Liberty Bell Middle School (math 43% / reading 38%, grade F, #42 of 333 statewide, top 13%, 898 students, 0% FRL); Science Hill High School (math 37% / reading 60%, grade D, #13 of 332 statewide, top 4%, 2,401 students, 0% FRL) — zoned schools average 0% FRL vs 44% district-wide (44 pts lower); this property's tenant base skews higher-income than the district average.
- Market conditions: Rents rising (+1.5%/yr); 207 active listings in the ZIP; 28 comparable units currently listed for rent nearby; rentals at typical pace (median 21d on market — plan ~3-4 weeks tenant-placement turnaround); 1,155 units permitted in Washington County in 2024 (437 in 5+ unit buildings).
Forward outlook
- Local home prices are declining (-3.0%/yr); year-one equity from $11 of loan paydown is wiped out by about $48 of value loss. Plan a longer hold.
- Washington County population projected at +9% by 2050 — modest demand growth; plan on rents tracking national, not racing it.
- At projected returns (-3.0% appreciation + 1.5% rent growth), your $448 cash investment doubles in ~1 year — after that, you're playing with house money.
Negotiation context
- It's been on market 40 days — a 3% lower offer ($2k) is reasonable based on typical stale-listing flexibility.
Questions for the listing agent
- It's been on market 40 days. Have you received any prior offers? Is the seller open to a 3% concession, seller financing, or rate buy-down credit?
- Is there a deadline driving the sale (1031 exchange, divorce, estate, relocation)? That informs how much negotiation room exists.
- Crime grade is D in this area — have there been break-ins, vandalism, or insurance claims at this property in the last 3 years? What carrier currently insures it and at what premium?
- The area grade is low — what's the realistic commute time and amenity access for the typical tenant pool here? Any planned neighborhood developments (good or bad) we should know about?
- What's the average days-on-market for RENTAL listings here right now (not sales)? A rising rental-DOM trend means longer vacancies and softer asking-rent achievability than the comps imply.
- What's the recent tenant-quality profile in this submarket — average credit score on applications, eviction rate, late-payment / NSF rate, and stable-employment percentage? A property-management company in the area should have these aggregated.
- How much new for-sale + rental construction is in the pipeline within 1–3 miles? Heavy new supply typically softens prices + rents 12–24 months out; constrained supply supports both.
Investment metrics
- 1% rule
- 81.55% ✓
- Cap rate
- 771.08%
- Cash-on-cash
- 2731.37%
- DSCR
- 122.53
- GRM
- 0.1
CMA / ARV
- ARV (median comp)
- $192,712
- List price
- $1,600
- Delta
- -99.17%
- Verdict
- UNDERPRICED
- Comps
- 20 within 1.0 mi
Show comp detail 12 sales within ~0.75 mi
| Address | Dist | Beds/Ba | Sqft | Sold | Price | $/sf | Match |
|---|---|---|---|---|---|---|---|
| 801 Magnolia Ext #3 | 0.00mi | 2/2.0 | 1,088 (0%) | 0mo | $1,600 | $1 | 100 |
| 801 Magnolia Ext #6 | 0.00mi | 2/2.0 | 1,088 (0%) | 0mo | $1,600 | $1 | 100 |
| 801 Magnolia Ext #5 | 0.00mi | 2/2.0 | 1,088 (0%) | 2mo | $1,600 | $1 | 99 |
| 801 Magnolia Ext #7 | 0.00mi | 2/2.0 | 1,088 (0%) | 16mo | $1,550 | $1 | 87 |
| 801 Magnolia Ext #1 | 0.00mi | 3/2.0 (+1) | 1,088 (0%) | 11mo | $1,600 | $1 | 86 |
| 506 Highland Rd | 0.37mi | 2/1.0 | 1,008 (-7%) | 10mo | $242,000 | $240 | 58 |
| 1907 Sinking Creek Rd | 0.50mi | 2/2.0 | 1,170 (+8%) | 10mo | $257,500 | $220 | 56 |
| 403 Poplar St | 0.72mi | 2/1.0 | 1,114 (+2%) | 7mo | $233,700 | $210 | 53 |
| 507 Poplar St | 0.56mi | 3/1.0 (+1) | 1,138 (+5%) | 9mo | $299,000 | $263 | 50 |
| 600 University Pkwy | 0.26mi | 2/1.0 | 924 (-15%) | 12mo | $198,500 | $215 | 49 |
| 409 Locust St | 0.74mi | 2/1.0 | 1,130 (+4%) | 9mo | $310,000 | $274 | 48 |
| 703 Rolling Hills Dr | 0.63mi | 3/1.0 (+1) | 1,186 (+9%) | 10mo | $103,000 | $87 | 38 |
Match score weights: distance 35% · size 25% · config 20% · recency 20%. Top-matched comps best support the ARV.
Projected returns pro-forma
-3.0% appreciation · 1.51% rent growth · sell at horizon
- IRR
- —
- Equity multiple
- 141.13×
- Total profit
- $62,779
- Equity at exit
- $239
- IRR
- —
- Equity multiple
- 292.74×
- Total profit
- $130,699
- Equity at exit
- $138
Cash invested: $448 (down + closing). Projections, not guarantees.
Landlord ↔ Tenant lean methodology
- Overall (STATE)
- 87 Strongly Landlord-Friendly
- State Tennessee
- 87 Strongly Landlord-Friendly · R+13
- County
- — inherits STATE
- City
- — inherits STATE
ZIP-level market 37604
- Home prices YoY
- -26.1%
- Rents YoY
- 1.5%
- Active inventory
- 207
- Price-to-rent
- 0.1×
Monthly cashflow live
- Estimated rent
- $1,305 high interval (Pro) →
- Mortgage (P&I)
- −$8
- Tax est. 1.5%
- −$2 /mo · $24/yr
- Insurance
- −$1
- HOA
- −$0
- Vacancy / Maint / Mgmt
- −$274
- Net cashflow
- $1,020
Break-even live
UW: 25.0% down · 7.5% · 30yr · 1.5% tax · 5.0% vac · 8.0% maint · 8.0% mgmt
Financing live
Cash to close
- Down payment
- $400
- Closing costs
- $48
- Reserves months
- —
- Total cash needed
- —
Loan-product check · same deal, 3 products live
Conventional
25% down · 7.5% · 30yr
- Down + closing
- —
- Monthly P&I
- —
- Monthly cashflow
- —
- DSCR
- —
- Eligible?
- —
Personal DTI + credit; lowest rate.
DSCR
20% down · 8.5% · 30yr
- Down + closing
- —
- Monthly P&I
- —
- Monthly cashflow
- —
- DSCR
- —
- Eligible?
- —
No personal income docs; deal must DSCR.
Hard money
10% down · 12.0% · 12mo
- Down + closing
- —
- Monthly P&I
- —
- Monthly cashflow
- —
- DSCR
- —
- Eligible?
- —
Short-term bridge; refi at stabilization.
Rent comps 28 comps
| Address | Beds | Baths | Sqft | Rent | $/sqft | DOM | Units | Dist |
|---|---|---|---|---|---|---|---|---|
| 1400 Virginia St Unit 2 Johnson City, TN | 2.0 | 1.0 | 1000 | $925 | $0.93 | 43d | 1 | 0.28mi |
| 701 W Locust St #22 Johnson City, TN | 2.0 | 1.5 | 1141 | $1,375 | $1.21 | 43d | 1 | 0.56mi |
| 616 W Maple St Unit 2 Johnson City, TN | 2.0 | 1.0 | 925 | $1,000 | $1.08 | 43d | 1 | 0.74mi |
| 1010 Buffalo St Unit 3 Johnson City, TN | 2.0 | 1.0 | 861 | $1,300 | $1.51 | 43d | 1 | 0.87mi |
| 404 W Maple St Unit 1 Johnson City, TN | 2.0 | 1.0 | 1000 | $1,050 | $1.05 | 43d | 1 | 0.88mi |
| 1505 Cherokee Rd #22 Johnson City, TN | 2.0 | 1.0 | 850 | $1,000 | $1.18 | 43d | 1 | 0.92mi |
| 220 Highland Ave Unit 1397973P Johnson City, TN | 2.0 | 1.0 | 925 | $3,993 | $4.32 | 13d | 1 | 0.97mi |
| 1816 Presswood Rd Johnson City, TN | 2.0 | 1.5 | 1092 | $1,300 | $1.19 | 13d | 1 | 0.99mi |
| 1707 Buccaneer Dr Johnson City, TN | 1.0–2.0 | 1.0 | 720 | $1,000 | $1.39 | 13d | 1 | 1.03mi |
| 1507 Linden St Unit 25 Johnson City, TN | 2.0 | 1.5 | 1150 | $1,125 | $0.98 | 13d | 1 | 1.09mi |
| 608 W Watauga Ave Unit 3 Johnson City, TN | 2.0 | 1.5 | 1000 | $1,200 | $1.20 | 43d | 1 | 1.12mi |
| 621 Lamont St Johnson City, TN | 3.0 | 1.0 | 925 | $1,500 | $1.62 | 13d | 1 | 1.14mi |
| 621 Hamilton St Johnson City, TN | 2.0 | 2.0 | 1184 | $1,725 | $1.46 | 21d | 1 | 1.22mi |
| 250 W Main St Apt 7 Johnson City, TN | 1.0 | 1.0 | 700 | $750 | $1.07 | 13d | 1 | 1.23mi |
| 268 W Main St Unit WM-06 Johnson City, TN | 2.0 | 1.0 | 960 | $1,350 | $1.41 | 13d | 1 | 1.24mi |
| 116 E Market St Johnson City, TN | 2.0 | 2.5 | 1249 | $1,700 | $1.36 | 13d | 1 | 1.25mi |
| 407 S Roan St Johnson City, TN | 1.0 | 1.0 | 716 | $1,250 | $1.74 | 13d | 2 | 1.25mi |
| 405 W Watauga Ave Unit WAT-34 Johnson City, TN | 1.0 | 1.0 | 872 | $1,150 | $1.32 | 43d | 1 | 1.25mi |
| 1729 Mary St Johnson City, TN | 3.0 | 1.0 | 890 | $1,450 | $1.63 | 43d | 1 | 1.29mi |
| 169 Grand Ave #101 heuristic Johnson City, TN | 2.0 | 2.0 | 1080 | $2,500 | $2.31 | 25d | 1 | 1.30mi |
| 169 Grande Ave #100 heuristic Johnson City, TN | 2.0 | 2.0 | 1080 | $2,500 | $2.31 | 25d | 1 | 1.30mi |
| 169 Grande Ave #200 heuristic Johnson City, TN | 2.0 | 2.0 | 1080 | $2,500 | $2.31 | 25d | 1 | 1.30mi |
| 169 Grand Ave #300 heuristic Johnson City, TN | 2.0 | 2.0 | 792 | $2,500 | $3.16 | 25d | 1 | 1.30mi |
| 169 Grand Ave #401 heuristic Johnson City, TN | 2.0 | 2.0 | 792 | $2,500 | $3.16 | 25d | 1 | 1.30mi |
| 168 E Grande Ave Unit 04 Johnson City, TN | 2.0 | 2.0 | 800 | $1,350 | $1.69 | 21d | 1 | 1.32mi |
| 829 Hamilton St Johnson City, TN | 3.0 | 2.0 | 1324 | $2,100 | $1.59 | 21d | 1 | 1.34mi |
| 2560 Plymouth Rd Johnson City, TN | 2.0–3.0 | 2.0 | 1163 | $980 | $0.84 | 13d | 1 | 1.38mi |
| 2610 Plymouth Rd Johnson City, TN | 1.0–3.0 | 1.0–2.0 | 855 | $1,288 | $1.50 | 13d | 6 | 1.48mi |
Listing history 13 events
-
2026-06-16days on market $1,600 Active 40 DOM
-
2026-06-15days on market $1,600 Active 39 DOM
-
2026-06-14days on market $1,600 Active 37 DOM
-
2026-06-13days on market $1,600 Active 36 DOM
-
2026-06-10days on market $1,600 Active 34 DOM
-
2026-06-09days on market $1,600 Active 33 DOM
-
2026-06-08days on market $1,600 Active 32 DOM
-
2026-06-07days on market $1,600 Active 31 DOM
-
2026-06-02days on market $1,600 Active 26 DOM
-
2026-06-01days on market $1,600 Active 25 DOM
-
2026-05-31days on market $1,600 Active 24 DOM
-
2026-05-30days on market $1,600 Active 23 DOM
-
2026-05-07$1,600 Active 1392-char remark
ⓘ Source: listings_history table (triggers on properties + properties_extension) + one-shot
backfill from property_details.listing_events for pre-trigger history.
Climate risk First Street
- Flood 1/10 Low FEMA zone X (unshaded) · 0% chance over 30 yrs
- Wildfire 3/10 Moderate
- Heat 4/10 Moderate 6 d/yr ≥95°F today · 18 d/yr by 30 yrs out
- Wind 2/10 Low
- Air quality 2/10 Low 1 unhealthy d/yr today · 1 by 30 yrs out
Nearby sold comps map
Loading sold comps map…
Walkable amenities ~0.75 mi
Loading nearby amenities…
Taxation est. · year 1
- Rental income
- $15,657
- − Mortgage interest
- −$90
- − Property taxes
- −$24
- − Insurance
- −$8
- − Repairs & maintenance
- −$1,253
- − Management
- −$1,253
- − Depreciation
- −$47
- Taxable income
- $12,984
- Est. tax owed @ 24.0%
- −$3,116
- After-tax cash flow
- $9,120/yr
For passive investors: Depreciation is non-cash, so a rental often shows a tax loss while cash-flowing — sheltering income. Rental losses are passive: they offset passive income freely, and up to $25,000/yr can offset ordinary (W-2) income if you actively participate and your MAGI is under $100k (phasing out to $0 by $150k); unused losses carry forward. On sale, claimed depreciation is recaptured at up to 25%, and gains may owe capital-gains tax (a 1031 exchange can defer both). Figures are a year-1 estimate at your 24.0% rate — not tax advice; consult a CPA.
Schools (NCES district)
- District
- Johnson City
- NCES district ID
- 4702130
- Math proficiency
- 46% ▼ -14.00%
- Reading proficiency
- 47% ▼ -2.00%
- Median HH income
- $37,514
- Composite
- 38.69/100
- National rank
- #4143
- State rank
- #9 of 139 in TN
Livability — Johnson City
- Score
- 76/100
- State rank
- #8
- US rank
- #3349
Category grades
Schools grade is shown separately in the Schools card above.
Census & demographics
- Census place
- Johnson City, TN
- County
- Washington County · 129,006 people
- City population
- 99,926
- Metro
- Johnson City, TN
- Population (ZIP)
- 39,097
- Household income
- $52,345
- Rent vs Own
- Severe rent burden
- 2254.0
Population outlook (Washington County) Hauer SSP2
- Today (2025)
- 132,816 people
- By 2030
- 135,823 · +2.3%
- By 2040
- 140,897 · +6.1%
- By 2050
- 145,073 · +9.2%
- By 2075
- 156,386 · +17.7%
- By 2100
- 159,893 · +20.4%
Race, ethnicity, and origin ACS 2023
- Neighborhood character
- Predominantly White (83%)
- Race & ethnicity
- White 83% Hispanic / Latino 6% Black 6% Two or more races 5% Asian 1%
- Hispanic origin (detail)
- Mexican 3%
- Common ancestry
- Slovak 3% Serbian 3% Italian 3%
- Foreign-born
- 4% · Canada
- Languages at home
- 94% English-only · Spanish 4% Other Indo-European 1%
Political lean MEDSL · Washington
- 2024 margin
- Solid R (+39.5) · D 29.6% · R 69.1% · Other 1.3%
- 2008→2024 swing
- -6.0pp toward R · 2008: -33.5pp · 2024: -39.5pp
- All cycles
- 2024: R+39.5 2020: R+36.2 2016: R+42.9 2012: R+38.5 2008: R+33.5
Not yet ingested
- Civics
- —
Market trends
- HPI YoY
- ▼ -97.73%
- Current HPI
- 277.1137
- Rent YoY
- ▲ 1.51%
- Metro
- Johnson City, TN
- State GDP YoY
- ▲ 2.78%
- F500 in state
- 22
Industry mix (Fortune 500 HQ in TN)
| Industry | F500 HQs | Revenue |
|---|---|---|
| Healthcare | 3 | $91B |
|
||
| Retail | 3 | $72B |
|
||
| Transportation / Logistics | 1 | $88B |
|
||
| Paper / Packaging | 1 | $19B |
|
||
| Insurance | 1 | $13B |
|
||
| Energy | 1 | $12B |
|
||
Price history
+0.0% since first listed2 events — show timeline
- 2026-06-16 Sold (MLS) $1,600 TVRMLS
- 2026-05-07 Listed $1,600 TVRMLS
Cash-flow waterfall
monthlySold comps — $/sqft
last 12 mo · ≤1 miLoading sold comps…