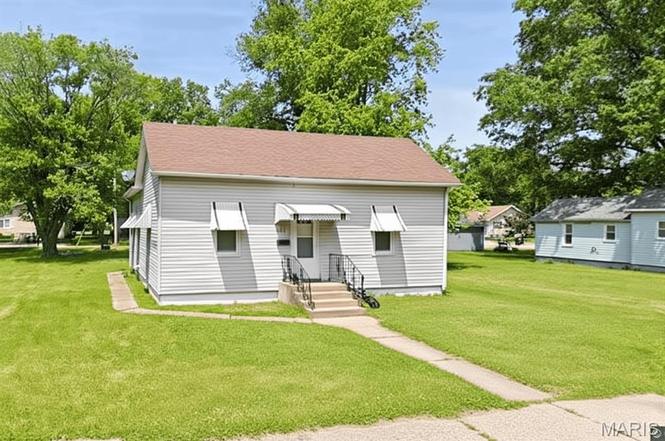
205 E 2nd North St
Mount Olive, IL 62069
$109,900F
2 bd · 1.0 ba ·
1,000 sqft ·
Built 1940
· SingleFamily
· Pending
· 110 DOM
Cashflow @ list (25.0% down · 7.5%)
Estimated rent
$890/mo
Mortgage (P&I)
−$576
Tax + insurance
−$209
HOA
−$0
Vac / Maint / Mgmt
−$187
Net cashflow
$-82/mo
Annual
$-989/yr
Cap rate
5.39%
Cash-on-cash
-3.21%
DSCR
0.86
1% rule
0.81%
Cash to close
$30,772
Investor read
- This is a 2-bed/1.0-bath single-family listed at $110k.
- At list price, monthly cash flow is $-82 ($-989/yr) — negative.
- To cash-flow at today's rent, offer at most $95k (13.2% below list).
- To meet the 1% rule (rent ≥ 1% of price), the offer needs to be $89k (19.0% below list).
- It's been on market 110 days — a 9% lower offer ($100k) is reasonable based on typical stale-listing flexibility.
- Recommended offer: $89k (19.0% below list) — sets the bar for 1% rule.
- In year one you build about $12k of equity ($760 loan paydown + $11k appreciation (10.0% local appreciation)).
- Location reads 61/100 on livability (#937 in IL) — a middle-class / working-renter tenant base. Strengths: cost of living A+, housing A+, crime A; Watch: employment D+, amenities F, commute F.
- Mount Olive CUSD 5 (rural): math 16% / reading 17% proficiency, ranked #483 of 620 in IL (top 78%) — low school quality limits family demand, transient renter base, plan for 1-2y turnover.
- Zoned schools: Mt Olive High School (math 24% / reading 34%, grade F, #187 of 693 statewide, top 30%, 126 students, 0% FRL) — zoned schools average 0% FRL vs 39% district-wide (39 pts lower); this property's tenant base skews higher-income than the district average.
- Zoned-school proficiency averages 30% at this address vs 16% district-wide (+13 pts) — the actual schools serving this property are materially stronger than the Mount Olive CUSD 5 average implies; a family-tenant draw the district grade alone would hide.
- Watch-outs: built in 1940 — expect roof / HVAC / electrical / plumbing capex.
- Market conditions: 21 active listings in the ZIP; 70 units permitted in Macoupin County in 2024 (0 in 5+ unit buildings).
- Macoupin County population projected at -27% by 2050 — secular population decline; favor cash flow + early exit over multi-decade hold.
- 2 sale attempts; this cycle's ask has dropped $16k (13%) from the opening price — seller is motivated, your offer sets the floor, not the list.
- Current owner paid $60k; list at $110k implies a 83% gain — meaningful room to come down on a strong offer.
- At projected returns (10.0% appreciation + 3.0% rent growth), your $31k cash investment doubles in ~3 years — after that, you're playing with house money.
- By year 4, paydown + projected appreciation supports a ~$42k cash-out refi (75% LTV) — recoverable capital for the next deal without selling this one.
Questions for listing agent
- What do current leases actually rent for vs. the listed asking? Can we see a recent rent roll and the last 12 months of T-12 income?
- It's been on market 110 days. Have you received any prior offers? Is the seller open to a 19% concession, seller financing, or rate buy-down credit?
- Built in 1940 — when were the roof, HVAC, electrical panel, plumbing, and water heater last replaced?
- Why hasn't it sold? Are there any deal-killer items the seller is aware of (foundation, flood, title, zoning, code violations)?
- Is there a deadline driving the sale (1031 exchange, divorce, estate, relocation)? That informs how much negotiation room exists.
- Schools are F-rated, which usually means shorter tenancies and higher turnover. Who's the typical renter profile here, and what's been the actual vacancy rate?
- The area grade is low — what's the realistic commute time and amenity access for the typical tenant pool here? Any planned neighborhood developments (good or bad) we should know about?
- What's the average days-on-market for RENTAL listings here right now (not sales)? A rising rental-DOM trend means longer vacancies and softer asking-rent achievability than the comps imply.
CashFlowRE · CFR-AXYWKQ8S8W070F
· Data 3 weeks ago
cashflowre.app · 2026-05-29