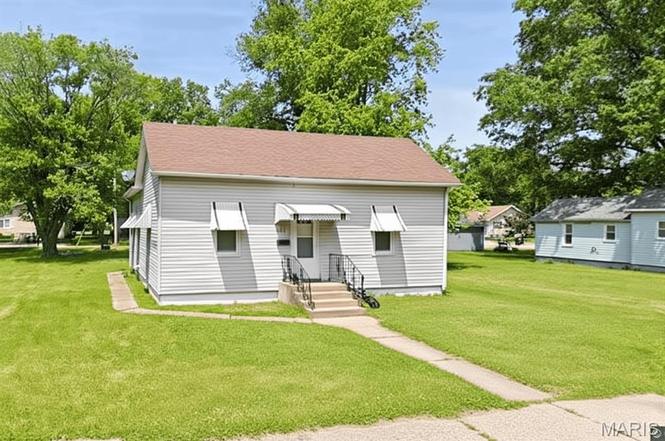
205 E 2nd North St · Mount Olive, IL
Flood risk 5/10 · Moderate
- FEMA flood zone
- —
- Chance of flooding over 30 yrs
- 0.66%
- Est. flood insurance / yr
- —
Fire risk 1/10 · Minimal
- Est. fire insurance / yr
- $804 – $1,492
Heat risk 4/10 · Minor
- Hot days now (above 105°F)
- 7 days/yr
- Hot days in 30 yrs
- 20 days/yr
Wind risk 2/10 · Minimal
- Chance of severe wind over 30 yrs
- 1.0%
Air-quality risk 2/10 · Minimal
- Unhealthy air days now
- 1 days/yr
- Unhealthy air days in 30 yrs
- 1 days/yr
Risk factors via First Street. Map © Google.
Why this score? — see what drove the F grade
The composite is a weighted blend of 9 inputs, each scored 0–100. Each bar is that input's sub-score; the figure is the points it added to the 100-point composite (weight × sub-score).
- Appreciation +10.0/10.0
- Cash flow +9.2/30.0
- 1% rule +3.1/10.0
- Livability +3.1/5.0
- DSCR +2.6/10.0
- Rent growth +2.5/5.0
- Condition / age +2.5/5.0
- Schools +1.5/10.0
- ARV discount +0.0/15.0
$109,900
🖨 Deal sheet 📄 Offer letter ✓ Due diligence
Listing remarks
Perfect starter home with updates already done! Seller offering $1,000 toward buyer closing costs. This charming 2-bedroom home offers comfortable living with nicely sized bedrooms and a well-thought-out, functional layout. The eat-in kitchen is a true standout, featuring beautiful granite countertops — a major upgrade, especially at this price point — along with plenty of space for everyday meals or casual entertaining. You’ll love the newer luxury vinyl plank flooring, which adds both style and durability throughout the home, paired with updated mechanicals including an HVAC system and water heater replaced in 2020 for peace of mind. Just off the back, a versatile bonus
Key facts
- 0.24 acre lot
- Built 1940
- Listed 110 days
Property features AI
Exterior
- Utilities: Community water; Public sewer; Electric service by Ameren; Cable available
- Home design: Single-family residence; One story
- Construction: Vinyl siding
- Exterior features: Lot approximately 0.241 acre (about 10,500 sq ft)
Interior
- Kitchen: Gas cooktop; Dishwasher; Refrigerator
- Bedrooms: Two bedrooms on the main level
- Bathrooms: One full bathroom on the main level
- Heating & cooling: Forced air heating; Central air conditioning
- Interior features: Open living area; Mud room; Basement with 8 ft+ poured walls
- Laundry & utility: Washer and dryer included
Neighborhood map
What this means for you Summary
Snapshot
- This is a 2-bed/1.0-bath single-family listed at $110k.
Deal economics
- At list price, monthly cash flow is $-82 ($-989/yr) — negative.
- To cash-flow at today's rent, offer at most $95k (13.2% below list).
- To meet the 1% rule (rent ≥ 1% of price), the offer needs to be $89k (19.0% below list).
- Recommended offer: $89k (19.0% below list) — sets the bar for 1% rule.
Location & tenants
- Location reads 61/100 on livability (#937 in IL) — a middle-class / working-renter tenant base. Strengths: cost of living A+, housing A+, crime A; Watch: employment D+, amenities F, commute F.
- Mount Olive CUSD 5 (rural): math 16% / reading 17% proficiency, ranked #483 of 620 in IL (top 78%) — low school quality limits family demand, transient renter base, plan for 1-2y turnover.
- Zoned schools: Mt Olive High School (math 24% / reading 34%, grade F, #187 of 693 statewide, top 30%, 126 students, 0% FRL) — zoned schools average 0% FRL vs 39% district-wide (39 pts lower); this property's tenant base skews higher-income than the district average.
- Zoned-school proficiency averages 30% at this address vs 16% district-wide (+13 pts) — the actual schools serving this property are materially stronger than the Mount Olive CUSD 5 average implies; a family-tenant draw the district grade alone would hide.
- Market conditions: 20 active listings in the ZIP; 70 units permitted in Macoupin County in 2024 (0 in 5+ unit buildings).
Forward outlook
- In year one you build about $12k of equity ($760 loan paydown + $11k appreciation (10.0% local appreciation)).
- Macoupin County population projected at -27% by 2050 — secular population decline; favor cash flow + early exit over multi-decade hold.
- At projected returns (10.0% appreciation + 3.0% rent growth), your $31k cash investment doubles in ~3 years — after that, you're playing with house money.
- By year 4, paydown + projected appreciation supports a ~$42k cash-out refi (75% LTV) — recoverable capital for the next deal without selling this one.
Negotiation context
- It's been on market 110 days — a 9% lower offer ($100k) is reasonable based on typical stale-listing flexibility.
- 2 sale attempts; this cycle's ask has dropped $16k (13%) from the opening price — seller is motivated, your offer sets the floor, not the list.
- Current owner paid $60k; list at $110k implies a 83% gain — meaningful room to come down on a strong offer.
Risks & watch-outs
- Watch-outs: built in 1940 — expect roof / HVAC / electrical / plumbing capex.
Questions for the listing agent
- What do current leases actually rent for vs. the listed asking? Can we see a recent rent roll and the last 12 months of T-12 income?
- It's been on market 110 days. Have you received any prior offers? Is the seller open to a 19% concession, seller financing, or rate buy-down credit?
- Built in 1940 — when were the roof, HVAC, electrical panel, plumbing, and water heater last replaced?
- Why hasn't it sold? Are there any deal-killer items the seller is aware of (foundation, flood, title, zoning, code violations)?
- Is there a deadline driving the sale (1031 exchange, divorce, estate, relocation)? That informs how much negotiation room exists.
- Schools are F-rated, which usually means shorter tenancies and higher turnover. Who's the typical renter profile here, and what's been the actual vacancy rate?
- The area grade is low — what's the realistic commute time and amenity access for the typical tenant pool here? Any planned neighborhood developments (good or bad) we should know about?
- What's the average days-on-market for RENTAL listings here right now (not sales)? A rising rental-DOM trend means longer vacancies and softer asking-rent achievability than the comps imply.
- What's the recent tenant-quality profile in this submarket — average credit score on applications, eviction rate, late-payment / NSF rate, and stable-employment percentage? A property-management company in the area should have these aggregated.
- How much new for-sale + rental construction is in the pipeline within 1–3 miles? Heavy new supply typically softens prices + rents 12–24 months out; constrained supply supports both.
Investment metrics
- 1% rule
- 0.81% ✗
- Cap rate
- 5.39%
- Cash-on-cash
- -3.21%
- DSCR
- 0.86
- GRM
- 10.3
CMA / ARV
- ARV (on-the-fly)
- $75,000
- Comps found
- 12
Show comp detail 12 sales within ~0.75 mi
| Address | Dist | Beds/Ba | Sqft | Sold | Price | $/sf | Match |
|---|---|---|---|---|---|---|---|
| 203 W 2nd North St | 0.19mi | 2/1.0 | 980 (-2%) | 3mo | $115,000 | $117 | 85 |
| 206 N Walnut St | 0.16mi | 3/1.0 (+1) | 1,017 (+2%) | 4mo | $59,900 | $59 | 81 |
| 301 E 7th North St | 0.33mi | 2/1.0 | 1,033 (+3%) | 5mo | $77,000 | $75 | 75 |
| 114 W 3rd South St | 0.39mi | 2/1.0 | 950 (-5%) | 6mo | $79,000 | $83 | 68 |
| 201 N Cherry St | 0.26mi | 2/1.0 | 1,100 (+10%) | 4mo | $69,000 | $63 | 67 |
| 310 N Maple St | 0.45mi | 2/0.5 | 1,050 (+5%) | 7mo | $120,000 | $114 | 63 |
| 304 W 3rd South St | 0.45mi | 2/1.0 | 1,050 (+5%) | 12mo | $60,000 | $57 | 61 |
| 300 E 3rd South St | 0.36mi | 1/1.0 (-1) | 1,100 (+10%) | 3mo | $64,900 | $59 | 59 |
| 505 W 2nd South St | 0.50mi | 2/1.0 | 960 (-4%) | 13mo | $25,000 | $26 | 59 |
| 411 S Walnut St | 0.44mi | 2/1.0 | 924 (-8%) | 10mo | $149,900 | $162 | 59 |
| 700 E 1st St N | 0.30mi | 2/1.5 | 928 (-7%) | 22mo | $79,900 | $86 | 54 |
| 110 Benton St | 0.55mi | 3/1.0 (+1) | 1,100 (+10%) | 19mo | $65,000 | $59 | 37 |
Match score weights: distance 35% · size 25% · config 20% · recency 20%. Top-matched comps best support the ARV.
Projected returns pro-forma
10.0% appreciation · 3.0% rent growth · sell at horizon
- IRR
- 22.0%
- Equity multiple
- 2.78×
- Total profit
- $54,635
- Equity at exit
- $99,007
- IRR
- 19.8%
- Equity multiple
- 6.36×
- Total profit
- $165,077
- Equity at exit
- $213,512
Cash invested: $30,772 (down + closing). Projections, not guarantees.
Landlord ↔ Tenant lean methodology
- Overall (STATE)
- 43 Moderately Tenant-Leaning
- State Illinois
- 43 Moderately Tenant-Leaning · D+7
- County
- — inherits STATE
- City
- — inherits STATE
ZIP-level market 62069
- Home prices YoY
- 12.0%
- Active inventory
- 20
- Price-to-rent
- 10.3×
Monthly cashflow live
- Estimated rent
- $890 medium interval (Pro) →
- Mortgage (P&I)
- −$576
- Tax from tax record
- −$164 /mo · $1,963/yr
- Insurance
- −$46
- HOA
- −$0
- Vacancy / Maint / Mgmt
- −$187
- Net cashflow
- $-82
Break-even live
UW: 25.0% down · 7.5% · 30yr · 1.5% tax · 5.0% vac · 8.0% maint · 8.0% mgmt
Financing live
Cash to close
- Down payment
- $27,475
- Closing costs
- $3,297
- Reserves months
- —
- Total cash needed
- —
Loan-product check · same deal, 3 products live
Conventional
25% down · 7.5% · 30yr
- Down + closing
- —
- Monthly P&I
- —
- Monthly cashflow
- —
- DSCR
- —
- Eligible?
- —
Personal DTI + credit; lowest rate.
DSCR
20% down · 8.5% · 30yr
- Down + closing
- —
- Monthly P&I
- —
- Monthly cashflow
- —
- DSCR
- —
- Eligible?
- —
No personal income docs; deal must DSCR.
Hard money
10% down · 12.0% · 12mo
- Down + closing
- —
- Monthly P&I
- —
- Monthly cashflow
- —
- DSCR
- —
- Eligible?
- —
Short-term bridge; refi at stabilization.
Listing history 10 events
-
2026-05-11status Pending
-
2026-04-13historical Active Under Contract
-
2026-04-06status Active
-
2026-04-02historical Active Under Contract
-
2026-03-18price $109,900
-
2026-02-16price $115,000
-
2026-02-01price $119,900
-
2026-01-21$125,900 Active
-
2026-01-14historical $125,900
-
2006-08-02soldstatus $60,000
ⓘ Source: listings_history table (triggers on properties + properties_extension) + one-shot
backfill from property_details.listing_events for pre-trigger history.
Tax reassessment forecast IL · Partial reset (capped growth)
- Current annual tax
- $1,963 · $164/mo
- Projected year-2 tax
- $2,229 · $186/mo
- Expected delta
- +$266/yr (+$22/mo · 13.5%)
ⓘ Screening estimate from a state-policy table — verify with the county assessor before closing.
Climate risk First Street
- Flood 5/10 Major 66% chance over 30 yrs
- Wildfire 1/10 Low
- Heat 4/10 Moderate 7 d/yr ≥105°F today · 20 d/yr by 30 yrs out
- Wind 2/10 Low 100% chance of damaging wind over 30 yrs
- Air quality 2/10 Low 1 unhealthy d/yr today · 1 by 30 yrs out
Nearby sold comps map
Loading sold comps map…
Walkable amenities ~0.75 mi
Loading nearby amenities…
Taxation est. · year 1
- Rental income
- $10,683
- − Mortgage interest
- −$6,156
- − Property taxes
- −$1,963
- − Insurance
- −$550
- − Repairs & maintenance
- −$855
- − Management
- −$855
- − Depreciation
- −$3,197
- Taxable loss
- −$2,892
- Est. tax savings @ 24.0%
- +$694
- After-tax cash flow
- $-295/yr
For passive investors: Depreciation is non-cash, so a rental often shows a tax loss while cash-flowing — sheltering income. Rental losses are passive: they offset passive income freely, and up to $25,000/yr can offset ordinary (W-2) income if you actively participate and your MAGI is under $100k (phasing out to $0 by $150k); unused losses carry forward. On sale, claimed depreciation is recaptured at up to 25%, and gains may owe capital-gains tax (a 1031 exchange can defer both). Figures are a year-1 estimate at your 24.0% rate — not tax advice; consult a CPA.
Schools (NCES district)
- District
- Mount Olive CUSD 5
- NCES district ID
- 1727180
- Math proficiency
- 16% ▼ -21.00%
- Reading proficiency
- 17% ▼ -18.00%
- Median HH income
- $46,749
- Composite
- 14.7/100
- National rank
- #9402
- State rank
- #483 of 620 in IL
Livability — Mount Olive
- Score
- 61/100
- State rank
- #937
- US rank
- #18221
Category grades
Schools grade is shown separately in the Schools card above.
Census & demographics
- Census place
- Mount Olive, IL
- Population (ZIP)
- 3,102
Population outlook (Macoupin County) Hauer SSP2
- Today (2025)
- 42,867 people
- By 2030
- 40,796 · -4.8%
- By 2040
- 36,135 · -15.7%
- By 2050
- 31,469 · -26.6%
- By 2075
- 22,102 · -48.4%
- By 2100
- 15,380 · -64.1%
Race, ethnicity, and origin ACS 2023
- Neighborhood character
- Predominantly White (96%)
- Race & ethnicity
- White 96% Two or more races 3%
- Common ancestry
- Lithuanian 2% Iranian 2% Romanian 2%
- Foreign-born
- 1%
Political lean MEDSL · Macoupin
- 2024 margin
- Solid R (+39.2) · D 29.4% · R 68.7% · Other 1.9%
- 2008→2024 swing
- -49.0pp toward R · 2008: 9.8pp · 2024: -39.2pp
- All cycles
- 2024: R+39.2 2020: R+36.5 2016: R+35.0 2012: R+7.0 2008: D+9.8
Not yet ingested
- Civics
- —
Market trends
- HPI YoY
- ▲ 21.34%
- Current HPI
- 199.5
- Rent YoY
- —
- Metro
- —
- State GDP YoY
- ▲ 1.59%
- F500 in state
- 60
Industry mix (Fortune 500 HQ in IL)
| Industry | F500 HQs | Revenue |
|---|---|---|
| Insurance | 4 | $201B |
|
||
| Consumer Goods | 4 | $87B |
|
||
| Industrial Machinery | 3 | $64B |
|
||
| Healthcare | 2 | $55B |
|
||
| Retail / Pharmacy | 1 | $148B |
|
||
| Agriculture / Food | 1 | $86B |
|
||
Price history
+83.2% since first listed10 events — show timeline
- 2026-05-11 Pending — MARIS as Distributed by MLS Grid
- 2026-04-13 Contingent — MARIS as Distributed by MLS Grid
- 2026-04-06 Relisted — MARIS as Distributed by MLS Grid
- 2026-04-02 Contingent — MARIS as Distributed by MLS Grid
- 2026-03-18 Price Changed $109,900 MARIS as Distributed by MLS Grid
- 2026-02-16 Price Changed $115,000 MARIS as Distributed by MLS Grid
- 2026-02-01 Price Changed $119,900 MARIS as Distributed by MLS Grid
- 2026-01-21 Listed $125,900 MARIS as Distributed by MLS Grid
- 2026-01-14 Coming Soon $125,900 MARIS as Distributed by MLS Grid
- 2006-08-02 Sold (Public Records) $60,000 Public Records
Property tax history
+2.5%/yrLatest (2024): $1,963 · +7.0% YoY. Source: county tax records.
Cash-flow waterfall
monthlySold comps — $/sqft
last 12 mo · ≤1 miLoading sold comps…