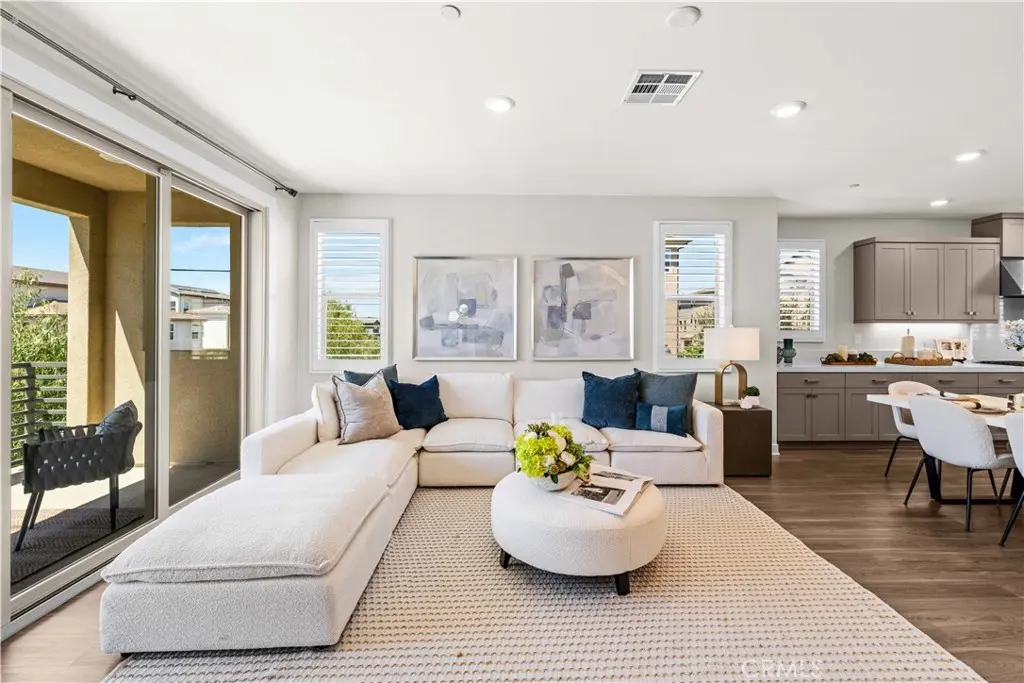
236 Keeper Dr
Irvine, CA 92618
$1,298,000D-
4 bd · 3.5 ba ·
2,173 sqft ·
Built 2021
· Condo
· Active
· 5 DOM
Cashflow @ list (25.0% down · 7.5%)
Estimated rent
$5,519/mo
Mortgage (P&I)
−$6,807
Tax + insurance
−$1,836
HOA
−$539
Vac / Maint / Mgmt
−$1,159
Net cashflow
$-4,822/mo
Annual
$-57,869/yr
Cap rate
1.83%
Cash-on-cash
-15.92%
DSCR
0.29
1% rule
0.43%
Cash to close
$363,440
Investor read
- This is a 4-bed/3.5-bath condo listed at $1.30M.
- At list price, monthly cash flow is $-5k ($-58k/yr) — negative.
- To cash-flow at today's rent, offer at most $446k (65.6% below list).
- To meet the 1% rule (rent ≥ 1% of price), the offer needs to be $552k (57.5% below list).
- Only 5 days on market — expect competitive offers; lowballing is unlikely to land.
- Recommended offer: $446k (65.6% below list) — sets the bar for cash-flow.
- In year one you build about $17k of equity ($9k loan paydown + $8k appreciation (0.6% local appreciation)).
- Location reads 76/100 on livability (#100 in CA, #3,537 nationally) — a middle-class / working-renter tenant base. Strengths: schools A+, crime A+, commute A+; Watch: health & safety C-, cost of living F.
- Irvine Unified (urban): math 74% / reading 80% proficiency, ranked #31 of 517 in CA (top 6%) — strong family-tenant draw, lease renewals of 3-5y typical; only 10% free/reduced lunch — higher-income household profile.
- Market conditions: Rents rising (+2.1%/yr); 455 active listings in the ZIP; 40 comparable units currently listed for rent nearby; rentals lingering (median 44d on market — plan ~5-8 weeks vacancy on turnover, expect pricing pressure); 50% of comp listings sitting > 30 days — soft ceiling on asking rent; high-income renter base; 6,974 units permitted in Orange County in 2024 (3,839 in 5+ unit buildings).
- Orange County population projected at +14% by 2050 — modest demand growth; plan on rents tracking national, not racing it.
- 2 sale attempts; this cycle's ask has dropped $92k (7%) from the opening price — seller is motivated, your offer sets the floor, not the list.
- By year 5, paydown + projected appreciation supports a ~$84k cash-out refi (75% LTV) — recoverable capital for the next deal without selling this one.
- Cap rate 1.8% vs local median 1.2% in Irvine — top-decile yield for the area; either an underpriced asset or a hidden risk that comps aren't pricing in. Stress-test before assuming the spread holds.
- At $5,519/mo this rent would consume 45% of the median local household income ($146k/yr) (locally 4078% of renters already pay >50% of income on rent) — very limited rent-growth headroom before tenants either downsize or default.
Questions for listing agent
- What do current leases actually rent for vs. the listed asking? Can we see a recent rent roll and the last 12 months of T-12 income?
- What does the HOA fee cover, when was the last increase, and are there any pending special assessments or reserve-fund shortfalls?
- Any open or pending special assessments — roof, HVAC, plumbing, elevator, façade? What's the per-unit balance and payoff schedule, and is the seller paying it off at close or rolling it to the buyer?
- Is there a deadline driving the sale (1031 exchange, divorce, estate, relocation)? That informs how much negotiation room exists.
- Schools are A-rated — typically a magnet for longer-tenancy family renters. What's the average tenant stay here, and is there a school-zone premium baked into asking?
- The area grade is low — what's the realistic commute time and amenity access for the typical tenant pool here? Any planned neighborhood developments (good or bad) we should know about?
- What's the average days-on-market for RENTAL listings here right now (not sales)? A rising rental-DOM trend means longer vacancies and softer asking-rent achievability than the comps imply.
- What's the recent tenant-quality profile in this submarket — average credit score on applications, eviction rate, late-payment / NSF rate, and stable-employment percentage? A property-management company in the area should have these aggregated.
CashFlowRE · CFR-AY3YRRE7T2D5RJ
· Data 2 days ago
cashflowre.app · 2026-05-29