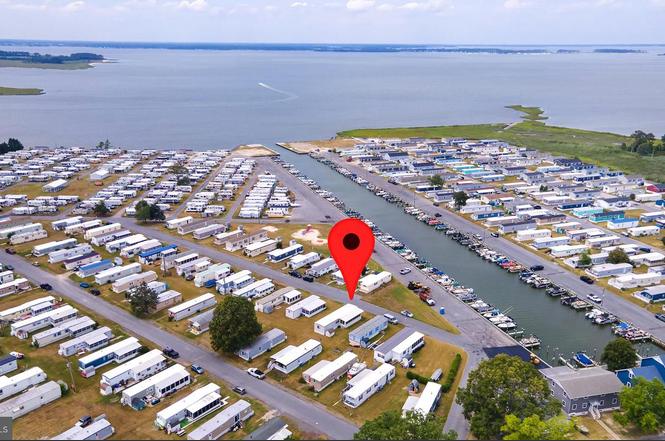
38052 Rabbit Rd
Ocean View, DE 19970
$100,000B
2 bd · 2.0 ba ·
840 sqft ·
Built 1981
· Manufactured
· Active
· 3 DOM
Cashflow @ list (25.0% down · 7.5%)
Estimated rent
$1,800/mo
Mortgage (P&I)
−$524
Tax + insurance
−$167
HOA
−$0
Vac / Maint / Mgmt
−$378
Net cashflow
$731/mo
Annual
$8,771/yr
Cap rate
15.06%
Cash-on-cash
31.33%
DSCR
2.39
1% rule
1.80%
Cash to close
$28,000
Investor read
- This is a 2-bed/2.0-bath manufactured listed at $100k.
- At list price, monthly cash flow is $731 ($9k/yr) — positive.
- The deal already cash-flows at list — no discount required.
- Meets the 1% rule at list price ($2k rent vs $100k).
- Only 3 days on market — expect competitive offers; lowballing is unlikely to land.
- Local home prices are declining (-3.0%/yr); year-one equity from $691 of loan paydown is wiped out by about $3k of value loss. Plan a longer hold.
- Location reads 69/100 on livability (#27 in DE) — a middle-class / working-renter tenant base. Strengths: crime A+, employment A+, housing A-; Watch: amenities F, commute F, cost of living F.
- Indian River School District (rural): math 25% / reading 41% proficiency, ranked #14 of 26 in DE (top 54%) — families likely to look elsewhere, expect single-tenant / working-renter base with shorter leases.
- Zoned schools: Lord Baltimore Elementary School (math 51% / reading 67%, grade B-, #4 of 105 statewide, top 4%, 579 students, 0% FRL); Sussex Central High School (math 23% / reading 42%, grade F, #24 of 40 statewide, top 59%, 2,039 students, 0% FRL) — zoned schools average 0% FRL vs 49% district-wide (49 pts lower); this property's tenant base skews higher-income than the district average.
- Zoned-school proficiency averages 46% at this address vs 33% district-wide (+13 pts) — the actual schools serving this property are materially stronger than the Indian River School District average implies; a family-tenant draw the district grade alone would hide.
- Market conditions: 231 active listings in the ZIP; 1 comparable units currently listed for rent nearby; 4,354 units permitted in Sussex County in 2024 (344 in 5+ unit buildings).
- Sussex County population projected at +25% by 2050 — long-run rental-demand tailwind backs the buy-and-hold thesis.
- At projected returns (-3.0% appreciation + 3.0% rent growth), your $28k cash investment doubles in ~4 years — after that, you're playing with house money.
- Climate carrying-cost: major flood risk; severe wind risk, 80% chance of damaging wind over 30y; extreme-heat days projected 7→18/yr by 2055 (HVAC capex compounding) — expect insurance premiums to compound above CPI over the hold.
- Cap rate 15.1% vs local median 1.9% in Ocean View — top-decile yield for the area; either an underpriced asset or a hidden risk that comps aren't pricing in. Stress-test before assuming the spread holds.
Questions for listing agent
- Is there a deadline driving the sale (1031 exchange, divorce, estate, relocation)? That informs how much negotiation room exists.
- Schools are A-rated — typically a magnet for longer-tenancy family renters. What's the average tenant stay here, and is there a school-zone premium baked into asking?
- What's the average days-on-market for RENTAL listings here right now (not sales)? A rising rental-DOM trend means longer vacancies and softer asking-rent achievability than the comps imply.
- What's the recent tenant-quality profile in this submarket — average credit score on applications, eviction rate, late-payment / NSF rate, and stable-employment percentage? A property-management company in the area should have these aggregated.
- How much new for-sale + rental construction is in the pipeline within 1–3 miles? Heavy new supply typically softens prices + rents 12–24 months out; constrained supply supports both.
CashFlowRE · CFR-AZPXT5B7KB24XM
· Data 2 days ago
cashflowre.app · 2026-05-29