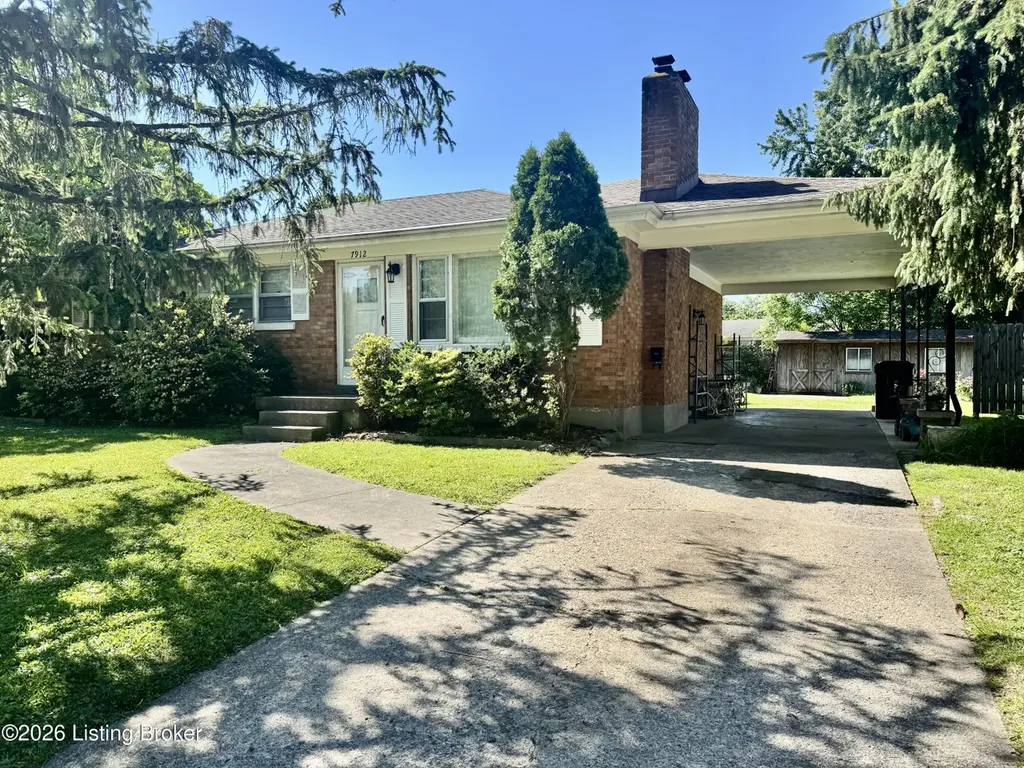
7912 Woodfern Way
Louisville/Jefferson County metro government (balance), KY 40291
$249,000C-
3 bd · 1.0 ba ·
1,804 sqft ·
Built 1956
· SingleFamily
· Pending
· 15 DOM
Cashflow @ list (25.0% down · 7.5%)
Estimated rent
$2,142/mo
Mortgage (P&I)
−$1,306
Tax + insurance
−$293
HOA
−$8
Vac / Maint / Mgmt
−$450
Net cashflow
$85/mo
Annual
$1,026/yr
Cap rate
6.70%
Cash-on-cash
1.47%
DSCR
1.07
1% rule
0.86%
Cash to close
$69,720
Investor read
- This is a 3-bed/1.0-bath single-family listed at $249k.
- At list price, monthly cash flow is $85 ($1k/yr) — positive.
- The deal already cash-flows at list — no discount required.
- To meet the 1% rule (rent ≥ 1% of price), the offer needs to be $214k (14.0% below list).
- It's been on market 15 days — a 2% lower offer ($245k) is reasonable based on typical stale-listing flexibility.
- Recommended offer: $214k (14.0% below list) — sets the bar for 1% rule.
- Local home prices are declining (-3.0%/yr); year-one equity from $2k of loan paydown is wiped out by about $7k of value loss. Plan a longer hold.
- Location reads: area grade C — affects rentability + tenant quality, not the cash-flow math above.
- Jefferson County (urban): math 19% / reading 35% proficiency, ranked #121 of 165 in KY (top 73%) — low school quality limits family demand, transient renter base, plan for 1-2y turnover.
- Zoned schools: Luhr Elementary (math 13% / reading 31%, grade F, #525 of 676 statewide, top 82%, 524 students, 62% FRL); Newburg Middle (math 14% / reading 36%, grade F, #184 of 217 statewide, top 87%, 941 students, 64% FRL); Fern Creek High (math 20% / reading 27%, grade F, #199 of 254 statewide, top 78%, 1,688 students, 60% FRL).
- Watch-outs: built in 1956 — expect roof / HVAC / electrical / plumbing capex.
- Market conditions: Rents rising fast (+15.0%/yr); 294 active listings in the ZIP; 8 comparable units currently listed for rent nearby; rentals at typical pace (median 22d on market — plan ~3-4 weeks tenant-placement turnaround); solid renter incomes; 2,836 units permitted in Jefferson County in 2024 (1,558 in 5+ unit buildings).
- Jefferson County population projected at +13% by 2050 — modest demand growth; plan on rents tracking national, not racing it.
- Climate carrying-cost: extreme-heat days projected 7→20/yr by 2055 (HVAC capex compounding) — expect insurance premiums to compound above CPI over the hold.
- Cap rate 6.7% vs local median 4.0% in Louisville/Jefferson County metro government (balance) — top-decile yield for the area; either an underpriced asset or a hidden risk that comps aren't pricing in. Stress-test before assuming the spread holds.
- This rent runs 32% of the median local income ($81k/yr) — at the standard rent-burdened threshold; future hikes will face affordability resistance.
Questions for listing agent
- Built in 1956 — when were the roof, HVAC, electrical panel, plumbing, and water heater last replaced?
- What does the HOA fee cover, when was the last increase, and are there any pending special assessments or reserve-fund shortfalls?
- Is there a deadline driving the sale (1031 exchange, divorce, estate, relocation)? That informs how much negotiation room exists.
- What's the average days-on-market for RENTAL listings here right now (not sales)? A rising rental-DOM trend means longer vacancies and softer asking-rent achievability than the comps imply.
- What's the recent tenant-quality profile in this submarket — average credit score on applications, eviction rate, late-payment / NSF rate, and stable-employment percentage? A property-management company in the area should have these aggregated.
- How much new for-sale + rental construction is in the pipeline within 1–3 miles? Heavy new supply typically softens prices + rents 12–24 months out; constrained supply supports both.
CashFlowRE · CFR-B09YRJ4569CY45
· Data 4 weeks ago
cashflowre.app · 2026-05-29