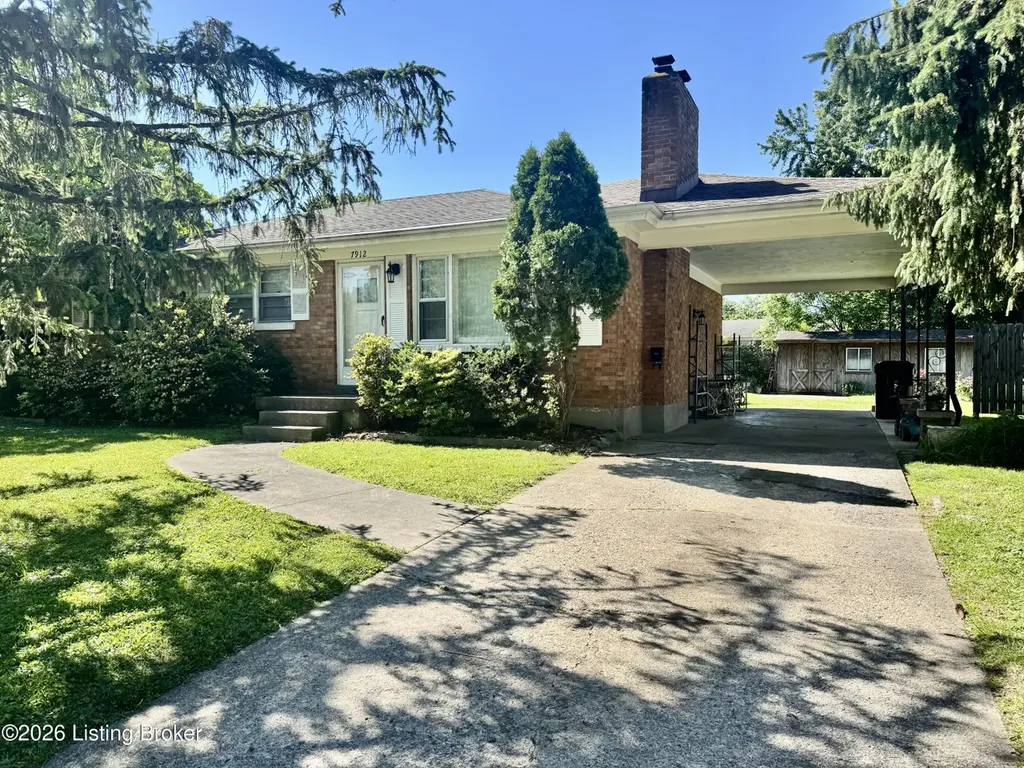
7912 Woodfern Way · Louisville/Jefferson County metro government (balance), KY
Flood risk 1/10 · Minimal
- FEMA flood zone
- X (unshaded)
- Chance of flooding over 30 yrs
- 0.0%
- Est. flood insurance / yr
- $473 – $860
Fire risk 1/10 · Minimal
- Est. fire insurance / yr
- $839 – $1,559
Heat risk 5/10 · Moderate
- Hot days now (above 104°F)
- 7 days/yr
- Hot days in 30 yrs
- 20 days/yr
Wind risk 2/10 · Minimal
- Chance of severe wind over 30 yrs
- 3.0%
Air-quality risk 3/10 · Minor
- Unhealthy air days now
- 2 days/yr
- Unhealthy air days in 30 yrs
- 5 days/yr
Risk factors via First Street. Map © Google.
Why this score? — see what drove the C- grade
The composite is a weighted blend of 9 inputs, each scored 0–100. Each bar is that input's sub-score; the figure is the points it added to the 100-point composite (weight × sub-score).
- Cash flow +15.2/30.0
- ARV discount +15.0/15.0
- Rent growth +5.0/5.0
- DSCR +4.7/10.0
- 1% rule +3.6/10.0
- Livability +2.5/5.0
- Condition / age +2.5/5.0
- Schools +2.3/10.0
- Appreciation +0.0/10.0
$249,000
🖨 Deal sheet (PDF) 📄 Offer letter ✓ Due diligence
Listing remarks
This 3-bedroom brick ranch at 7912 Woodfern Way in Louisville, KY 40291 has the kind of curb appeal and bones that are hard to find in this price range. The main level has hardwood floors throughout, a brick wood-burning fireplace in the living room, and an eat-in kitchen with good cabinet storage. All three bedrooms have ceiling fans and closets. The full bath has original tile that is clean and well-kept. The finished basement adds two large rooms with wood paneling, built-in shelving, and multiple closets — ready for a rec room, home office, or hobby space. Outside, the large fenced backyard has a carport, a concrete driveway, and two detached sheds with plenty of room for tools, s
Key facts
- Eat in kitchen
- Ceiling fans
- Good cabinet storage
Tags
Property features AI
Finance
- HOA & community: Homeowners association with a $100 monthly fee; Located in the Fern Creek Gardens subdivision
Exterior
- Parking: Driveway parking
- Utilities: Electricity connected; Natural gas available
- Home design: Single-family ranch-style home; One story
- Construction: Built in 1956; Wood frame construction; Shingle roof; Poured concrete foundation
- Exterior features: Partial wood fencing; Lot approximately 0.21 acres
Interior
- Kitchen: Eat-in kitchen on the first floor
- Bedrooms: 3 bedrooms total; Primary bedroom on the first floor; All bedrooms located on the first floor
- Bathrooms: One full bathroom on the first floor
- Heating & cooling: Forced-air heating (natural gas); Central air conditioning
- Interior features: Partially finished basement; One fireplace; Great room; Living room; Total of 9 rooms
- Laundry & utility: Laundry room in the basement (no first-floor laundry)
Neighborhood map
What this means for you Summary
Snapshot
- This is a 3-bed/1.0-bath single-family listed at $249k.
Deal economics
- At list price, monthly cash flow is $85 ($1k/yr) — positive.
- The deal already cash-flows at list — no discount required.
- To meet the 1% rule (rent ≥ 1% of price), the offer needs to be $214k (14.0% below list).
- Recommended offer: $214k (14.0% below list) — sets the bar for 1% rule.
- Cap rate 6.7% vs local median 4.0% in Louisville/Jefferson County metro government (balance) — top-decile yield for the area; either an underpriced asset or a hidden risk that comps aren't pricing in. Stress-test before assuming the spread holds.
Location & tenants
- Location reads: area grade C — affects rentability + tenant quality, not the cash-flow math above.
- Jefferson County (urban): math 19% / reading 35% proficiency, ranked #121 of 165 in KY (top 73%) — low school quality limits family demand, transient renter base, plan for 1-2y turnover.
- Zoned schools: Luhr Elementary (math 13% / reading 31%, grade F, #525 of 676 statewide, top 82%, 524 students, 62% FRL); Newburg Middle (math 14% / reading 36%, grade F, #184 of 217 statewide, top 87%, 941 students, 64% FRL); Fern Creek High (math 20% / reading 27%, grade F, #199 of 254 statewide, top 78%, 1,688 students, 60% FRL).
- Market conditions: Rents rising fast (+15.0%/yr); 294 active listings in the ZIP; 8 comparable units currently listed for rent nearby; rentals at typical pace (median 22d on market — plan ~3-4 weeks tenant-placement turnaround); solid renter incomes; 2,836 units permitted in Jefferson County in 2024 (1,558 in 5+ unit buildings).
- This rent runs 32% of the median local income ($81k/yr) — at the standard rent-burdened threshold; future hikes will face affordability resistance.
Forward outlook
- Local home prices are declining (-3.0%/yr); year-one equity from $2k of loan paydown is wiped out by about $7k of value loss. Plan a longer hold.
- Jefferson County population projected at +13% by 2050 — modest demand growth; plan on rents tracking national, not racing it.
Negotiation context
- It's been on market 15 days — a 2% lower offer ($245k) is reasonable based on typical stale-listing flexibility.
Risks & watch-outs
- Watch-outs: built in 1956 — expect roof / HVAC / electrical / plumbing capex.
- Climate carrying-cost: extreme-heat days projected 7→20/yr by 2055 (HVAC capex compounding) — expect insurance premiums to compound above CPI over the hold.
Questions for the listing agent
- Built in 1956 — when were the roof, HVAC, electrical panel, plumbing, and water heater last replaced?
- What does the HOA fee cover, when was the last increase, and are there any pending special assessments or reserve-fund shortfalls?
- Is there a deadline driving the sale (1031 exchange, divorce, estate, relocation)? That informs how much negotiation room exists.
- What's the average days-on-market for RENTAL listings here right now (not sales)? A rising rental-DOM trend means longer vacancies and softer asking-rent achievability than the comps imply.
- What's the recent tenant-quality profile in this submarket — average credit score on applications, eviction rate, late-payment / NSF rate, and stable-employment percentage? A property-management company in the area should have these aggregated.
- How much new for-sale + rental construction is in the pipeline within 1–3 miles? Heavy new supply typically softens prices + rents 12–24 months out; constrained supply supports both.
Investment metrics
- 1% rule
- 0.86% ✗
- Cap rate
- 6.70%
- Cash-on-cash
- 1.47%
- DSCR
- 1.07
- GRM
- 9.7
CMA / ARV
- ARV (on-the-fly)
- $308,484
- Comps found
- 12
Show comp detail 12 sales within ~0.75 mi
| Address | Dist | Beds/Ba | Sqft | Sold | Price | $/sf | Match |
|---|---|---|---|---|---|---|---|
| 7206 Brett Frazier Dr | 0.22mi | 3/2.0 | 1,719 (-5%) | 1mo | $352,500 | $205 | 77 |
| 7804 Davhal Dr | 0.13mi | 4/2.0 (+1) | 2,002 (+11%) | 1mo | $315,000 | $157 | 65 |
| 8501 Fernview Dr | 0.58mi | 3/1.5 | 1,747 (-3%) | 2mo | $260,000 | $149 | 64 |
| 6801 Fordham Ln | 0.39mi | 4/2.0 (+1) | 1,719 (-5%) | 2mo | $325,000 | $189 | 63 |
| 6905 S Watterson Trl | 0.30mi | 4/1.5 (+1) | 1,644 (-9%) | 3mo | $242,000 | $147 | 61 |
| 8100 Eagles Crest Ct | 0.57mi | 3/2.0 | 1,656 (-8%) | 2mo | $314,900 | $190 | 54 |
| 8705 Running Fox Cir | 0.61mi | 3/1.0 | 1,557 (-14%) | 1mo | $237,000 | $152 | 48 |
| 8102 Village Point Dr | 0.62mi | 3/2.0 | 1,585 (-12%) | 2mo | $299,000 | $189 | 46 |
| 7305 Jacks Lndg | 0.65mi | 4/2.5 (+1) | 2,015 (+12%) | 1mo | $339,900 | $169 | 38 |
| 7308 Jacks Lndg | 0.67mi | 4/2.5 (+1) | 2,015 (+12%) | 1mo | $344,900 | $171 | 38 |
| 8201 Jacks Hidden Cv | 0.64mi | 4/2.5 (+1) | 2,015 (+12%) | 3mo | $347,400 | $172 | 37 |
| Lot 14 Farmgate Crossings | 0.66mi | 4/2.5 (+1) | 2,015 (+12%) | 2mo | $344,900 | $171 | 37 |
Match score weights: distance 35% · size 25% · config 20% · recency 20%. Top-matched comps best support the ARV.
Projected returns pro-forma
-3.0% appreciation · 8.0% rent growth · sell at horizon
- IRR
- -8.8%
- Equity multiple
- 0.66×
- Total profit
- $-23,623
- Equity at exit
- $37,127
- IRR
- 6.0%
- Equity multiple
- 1.54×
- Total profit
- $37,807
- Equity at exit
- $21,529
Cash invested: $69,720 (down + closing). Projections, not guarantees.
Landlord ↔ Tenant lean methodology
- Overall (STATE)
- 83 Strongly Landlord-Friendly
- State Kentucky
- 83 Strongly Landlord-Friendly · R+16
- County
- — inherits STATE
- City
- — inherits STATE
ZIP-level market 40291
- Rents YoY
- 15.0%
- Active inventory
- 294
- Price-to-rent
- 9.7×
Monthly cashflow live
- Estimated rent
- $2,142 high interval (Pro) →
- Mortgage (P&I)
- −$1,306
- Tax from tax record
- −$189 /mo · $2,269/yr
- Insurance
- −$104
- HOA
- −$8
- Vacancy / Maint / Mgmt
- −$450
- Net cashflow
- $85
Break-even live
Sensitivity live
| Price | -10% $226 | -5% $156 | +0% $85 | +5% $15 | +10% $-55 |
|---|---|---|---|---|---|
| Rent | -10% $-84 | -5% $1 | +0% $85 | +5% $170 | +10% $255 |
| Rate | -1.0pp $211 | -0.5pp $149 | base $85 | +0.5pp $21 | +1.0pp $-45 |
UW: 25.0% down · 7.5% · 30yr · 1.5% tax · 5.0% vac · 8.0% maint · 8.0% mgmt
Financing live
Cash to close
- Down payment
- $62,250
- Closing costs
- $7,470
- Reserves months
- —
- Total cash needed
- —
Loan-product check · same deal, 3 products live
Conventional
25% down · 7.5% · 30yr
- Down + closing
- —
- Monthly P&I
- —
- Monthly cashflow
- —
- DSCR
- —
- Eligible?
- —
Personal DTI + credit; lowest rate.
DSCR
20% down · 8.5% · 30yr
- Down + closing
- —
- Monthly P&I
- —
- Monthly cashflow
- —
- DSCR
- —
- Eligible?
- —
No personal income docs; deal must DSCR.
Hard money
10% down · 12.0% · 12mo
- Down + closing
- —
- Monthly P&I
- —
- Monthly cashflow
- —
- DSCR
- —
- Eligible?
- —
Short-term bridge; refi at stabilization.
Rent comps 8 comps
| Address | Beds | Baths | Sqft | Rent | $/sqft | DOM | Units | Dist |
|---|---|---|---|---|---|---|---|---|
| 6306 Labor Ln Louisville, KY | 3.0 | 2.5 | 1880 | $1,999 | $1.06 | 17d | 1 | 0.31mi |
| 7610 Chelsea Gardens Cir Louisville, KY | 2.0–3.0 | 2.0 | 1220 | $2,011 | $1.65 | 4d | 21 | 0.58mi |
| 7017 Field View Ct Louisville, KY | 3.0 | 2.0 | 2600 | $2,330 | $0.90 | 4d | 1 | 0.59mi |
| 5705 Stone Bluff Rd Louisville, KY | 4.0 | 2.5 | 1800 | $2,300 | $1.28 | 23d | 1 | 1.08mi |
| 7400 Snow Bend Ave Louisville, KY | 1.0–3.0 | 1.0–2.0 | 1074 | $1,846 | $1.72 | 3d | 11 | 1.14mi |
| 8509 Gainsborough Dr Louisville, KY | 3.0 | 2.0 | 1764 | $2,130 | $1.21 | 21d | 1 | 1.31mi |
| 8217 Zelma Fields Ave Louisville, KY | 4.0 | 1.5 | 1644 | $1,795 | $1.09 | 25d | 1 | 1.44mi |
| 8001 Zelma Fields Ave Louisville, KY | 3.0 | 1.5 | 2422 | $1,900 | $0.78 | 25d | 1 | 1.44mi |
HOA detail
- Monthly dues
- $8 · $96/yr
Listing history 2 events
-
2026-05-20price $249,000
-
2026-05-08$269,000 Active
ⓘ Source: listings_history table (triggers on properties + properties_extension) + one-shot
backfill from property_details.listing_events for pre-trigger history.
Tax reassessment forecast KY · Resets to sale price
- Current annual tax
- $2,269 · $189/mo
- Projected year-2 tax
- $2,269 · $189/mo
- Expected delta
- $0/yr ($0/mo · 0.0%)
ⓘ Screening estimate from a state-policy table — verify with the county assessor before closing.
Climate risk First Street
- Flood 1/10 Low FEMA zone X (unshaded) · 0% chance over 30 yrs
- Wildfire 1/10 Low
- Heat 5/10 Major 7 d/yr ≥104°F today · 20 d/yr by 30 yrs out
- Wind 2/10 Low 3% chance of damaging wind over 30 yrs
- Air quality 3/10 Moderate 2 unhealthy d/yr today · 5 by 30 yrs out
Nearby sold comps map
Loading sold comps map…
Walkable amenities ~0.75 mi
Loading nearby amenities…
Taxation est. · year 1
- Rental income
- $25,703
- − Mortgage interest
- −$13,948
- − Property taxes
- −$2,269
- − Insurance
- −$1,245
- − Repairs & maintenance
- −$2,056
- − Management
- −$2,056
- − HOA
- −$96
- − Depreciation
- −$7,244
- Taxable loss
- −$3,211
- Est. tax savings @ 24.0%
- +$771
- After-tax cash flow
- $1,796/yr
For passive investors: Depreciation is non-cash, so a rental often shows a tax loss while cash-flowing — sheltering income. Rental losses are passive: they offset passive income freely, and up to $25,000/yr can offset ordinary (W-2) income if you actively participate and your MAGI is under $100k (phasing out to $0 by $150k); unused losses carry forward. On sale, claimed depreciation is recaptured at up to 25%, and gains may owe capital-gains tax (a 1031 exchange can defer both). Figures are a year-1 estimate at your 24.0% rate — not tax advice; consult a CPA.
Schools (NCES district)
- District
- Jefferson County
- NCES district ID
- 2102990
- Math proficiency
- 19% ▼ -17.00%
- Reading proficiency
- 35% ▼ -11.00%
- Median HH income
- $47,885
- Composite
- 23.45/100
- National rank
- #7884
- State rank
- #121 of 165 in KY
Livability — Louisville/Jefferson County metro government (balance)
No livability data for this city. (Only ~50 U.S. cities are tracked.)
Census & demographics
- Census place
- Louisville/Jefferson County metro government (balance), KY
- County
- Jefferson County · 790,184 people
- City population
- 419,741
- Metro
- Louisville/Jefferson County, KY-IN
- Population (ZIP)
- 41,222
- Household income
- $81,267
- Rent vs Own
- Severe rent burden
- 790.0
Population outlook (Jefferson County) Hauer SSP2
- Today (2025)
- 823,112 people
- By 2030
- 849,343 · +3.2%
- By 2040
- 895,696 · +8.8%
- By 2050
- 933,630 · +13.4%
- By 2075
- 1,028,262 · +24.9%
- By 2100
- 1,072,675 · +30.3%
Race, ethnicity, and origin ACS 2023
- Neighborhood character
- Predominantly White (66%)
- Race & ethnicity
- White 66% Black 19% Two or more races 8% Hispanic / Latino 8% Asian 3%
- Hispanic origin (detail)
- Mexican 4%
- Common ancestry
- Italian 4% Slovak 3% Lithuanian 2%
- Foreign-born
- 7% · Canada, India, Vietnam
- Languages at home
- 89% English-only · Spanish 4% Russian/Polish/Slavic 1% French/Haitian/Cajun 1%
Political lean MEDSL · Jefferson
- 2024 margin
- D (+16.6) · D 57.4% · R 40.9% · Other 1.7%
- 2008→2024 swing
- +4.5pp toward D · 2008: 12.0pp · 2024: 16.6pp
- All cycles
- 2024: D+16.6 2020: D+20.1 2016: D+13.3 2012: D+11.1 2008: D+12.0
Not yet ingested
- Civics
- —
Market trends
- HPI YoY
- ▼ -279.15%
- Current HPI
- 218.0784
- Rent YoY
- ▲ 14.96%
- Metro
- Louisville/Jefferson County, KY-IN
- State GDP YoY
- ▲ 1.81%
- F500 in state
- 4
Industry mix (Fortune 500 HQ in KY)
| Industry | F500 HQs | Revenue |
|---|---|---|
| Healthcare | 1 | $118B |
|
||
| Food / Beverage | 1 | $7B |
|
||
Price history
-7.4% since first listed2 events — show timeline
- 2026-05-20 Price Changed $249,000 Metro Search MLS
- 2026-05-08 Listed $269,000 Metro Search MLS
Property tax history
+8.6%/yrLatest (2025): $2,269 · +30.0% YoY. Source: county tax records.
Cash-flow waterfall
monthlySold comps — $/sqft
last 12 mo · ≤1 miLoading sold comps…