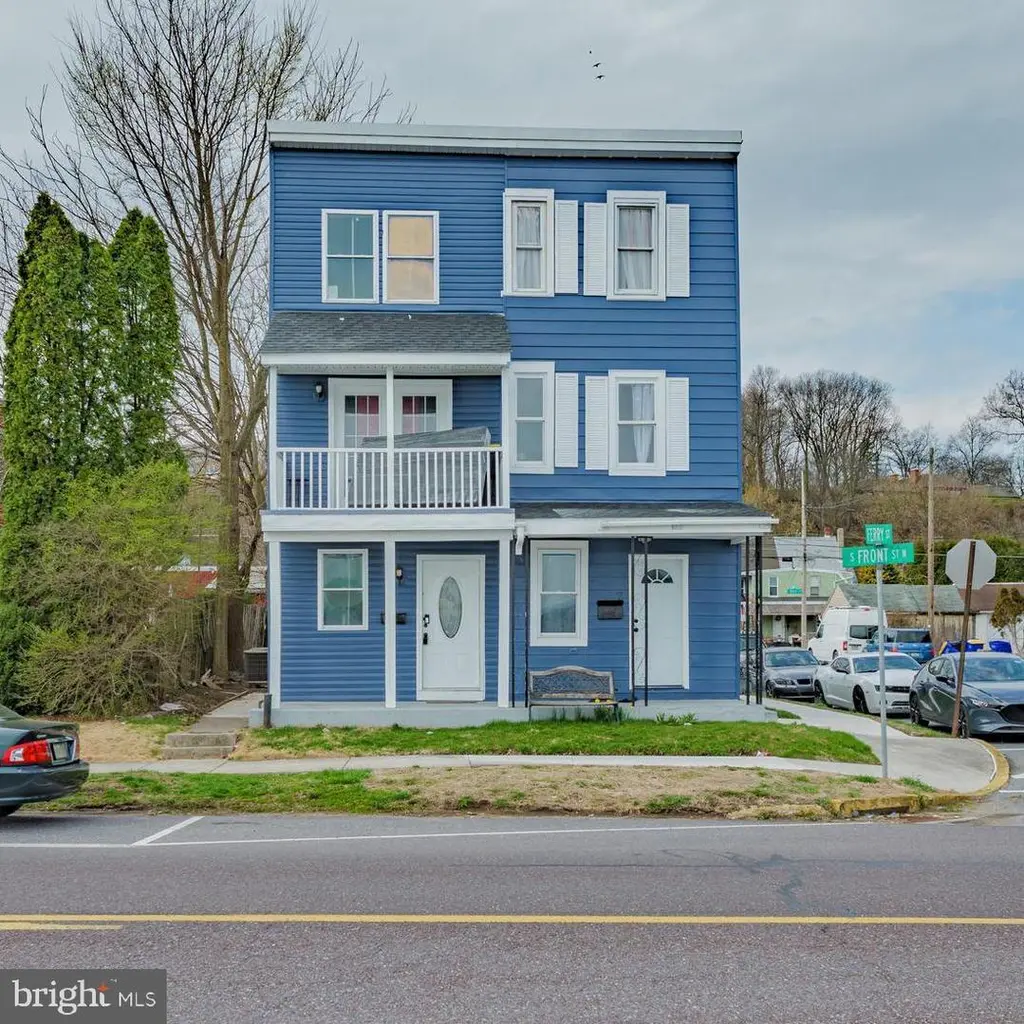
2-4 S Front St
Wormleysburg, PA 17043
$520,000D
3 bd · 2.0 ba ·
1,572 sqft ·
Built 1920
· MultiFamily
· Active
· 14 DOM
Cashflow @ list (25.0% down · 7.5%)
Estimated rent
$3,979/mo
Mortgage (P&I)
−$2,727
Tax + insurance
−$506
HOA
−$0
Vac / Maint / Mgmt
−$836
Net cashflow
$-90/mo
Annual
$-1,078/yr
Cap rate
6.24%
Cash-on-cash
-0.19%
DSCR
0.99
1% rule
0.77%
Cash to close
$145,600
Investor read
- This is a 2 × 4-bed/?-bath units multifamily listed at $520k.
- At list price, monthly cash flow is $-90 ($-1k/yr) — negative. Per door: $-45/mo.
- To cash-flow at today's rent, offer at most $504k (3.1% below list).
- To meet the 1% rule (rent ≥ 1% of price), the offer needs to be $398k (23.5% below list).
- Only 14 days on market — expect competitive offers; lowballing is unlikely to land.
- Recommended offer: $398k (23.5% below list) — sets the bar for 1% rule.
- Local home prices are declining (-3.0%/yr); year-one equity from $4k of loan paydown is wiped out by about $16k of value loss. Plan a longer hold.
- Location reads 79/100 on livability (#268 in PA, #2,349 nationally) — a middle-class / working-renter tenant base. Strengths: crime A+, cost of living A+, housing A+; Watch: amenities D, commute F.
- West Shore SD (suburban): math 37% / reading 56% proficiency, ranked #222 of 539 in PA (top 41%) — families likely to look elsewhere, expect single-tenant / working-renter base with shorter leases.
- Zoned schools: Cedar Cliff Hs (math 56% / reading 24%, grade F, #263 of 437 statewide, top 60%, 1,353 students, 39% FRL).
- Watch-outs: flood insurance adds $66/mo; built in 1920 — expect roof / HVAC / electrical / plumbing capex.
- Market conditions: 25 active listings in the ZIP; 23 comparable units currently listed for rent nearby; rentals at typical pace (median 24d on market — plan ~3-4 weeks tenant-placement turnaround); 43% of comp listings sitting > 30 days — soft ceiling on asking rent; 1,052 units permitted in Cumberland County in 2024 (310 in 5+ unit buildings).
- Cumberland County population projected at +17% by 2050 — long-run rental-demand tailwind backs the buy-and-hold thesis.
- Current owner paid $21k; list at $520k implies a 2376% gain — meaningful room to come down on a strong offer.
- Climate carrying-cost: severe flood risk; extreme-heat days projected 7→15/yr by 2055 (HVAC capex compounding) — expect insurance premiums to compound above CPI over the hold.
- At $3,979/mo this rent would consume 78% of the median local household income ($61k/yr) (locally 444% of renters already pay >50% of income on rent) — very limited rent-growth headroom before tenants either downsize or default.
Questions for listing agent
- What do current leases actually rent for vs. the listed asking? Can we see a recent rent roll and the last 12 months of T-12 income?
- Can we see the unit-by-unit rent roll, current vacancy, and any below-market leases? What's the average tenancy length?
- What capital expenditures (roof, boiler, parking lot, exteriors) have been made in the last 5 years, and what's planned in the next 2?
- Built in 1920 — when were the roof, HVAC, electrical panel, plumbing, and water heater last replaced?
- What's the actual annual flood-insurance premium (NFIP or private), and is the property in a SFHA with mandatory coverage?
- Is there a deadline driving the sale (1031 exchange, divorce, estate, relocation)? That informs how much negotiation room exists.
- The area grade is low — what's the realistic commute time and amenity access for the typical tenant pool here? Any planned neighborhood developments (good or bad) we should know about?
- What's the average days-on-market for RENTAL listings here right now (not sales)? A rising rental-DOM trend means longer vacancies and softer asking-rent achievability than the comps imply.
CashFlowRE · CFR-B0P9XGF53W39E2
· Data 2 days ago
cashflowre.app · 2026-05-29