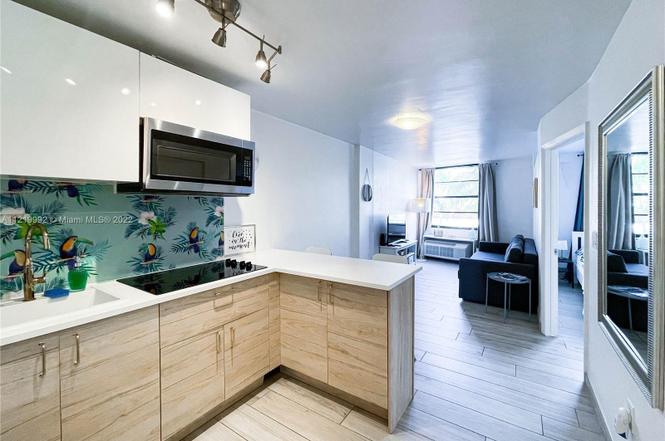
710 Washington Ave #323
Miami Beach, FL 33139
$264,000C-
1 bd · 1.0 ba ·
410 sqft ·
Built 1976
· Condo
· Active
· 277 DOM
Cashflow @ list (25.0% down · 7.5%)
Estimated rent
$3,258/mo
Mortgage (P&I)
−$1,384
Tax + insurance
−$404
HOA
−$580
Vac / Maint / Mgmt
−$684
Net cashflow
$205/mo
Annual
$2,463/yr
Cap rate
7.23%
Cash-on-cash
3.33%
DSCR
1.15
1% rule
1.23%
Cash to close
$73,920
Investor read
- This is a 1-bed/1.0-bath condo listed at $264k.
- At list price, monthly cash flow is $205 ($2k/yr) — positive.
- The deal already cash-flows at list — no discount required.
- Meets the 1% rule at list price ($3k rent vs $264k).
- It's been on market 277 days — a 12% lower offer ($232k) is reasonable based on typical stale-listing flexibility.
- Recommended offer: $232k (12.0% below list) — sets the bar for market timing.
- Local home prices are declining (-2.2%/yr); year-one equity from $2k of loan paydown is wiped out by about $6k of value loss. Plan a longer hold.
- Location reads 80/100 on livability (#108 in FL, #1,672 nationally) — a professional / high-income tenant draw. Strengths: crime A+, commute A+, health & safety A+; Watch: housing C-, amenities D-, cost of living F.
- Miami-Dade (suburban): math 45% / reading 54% proficiency, ranked #40 of 73 in FL (top 55%) — families likely to look elsewhere, expect single-tenant / working-renter base with shorter leases; 64% free/reduced lunch — lower-income household profile, screen leases tightly.
- Market conditions: Rents soft (-0.4%/yr); 1214 active listings in the ZIP; 10,051 units permitted in Miami-Dade County in 2024 (7,758 in 5+ unit buildings).
- Miami-Dade County population projected at +28% by 2050 — long-run rental-demand tailwind backs the buy-and-hold thesis.
- 12 sale attempts since 11y ago with the ask held roughly flat each time — persistent listings suggest the price (not the market) is what's stuck; bring a comps-based counter.
- Current owner paid $225k; 17% above their basis — modest negotiation headroom, anchor on the comps not their cost.
- Cap rate 7.2% vs local median 1.5% in Miami Beach — top-decile yield for the area; either an underpriced asset or a hidden risk that comps aren't pricing in. Stress-test before assuming the spread holds.
- At $3,258/mo this rent would consume 56% of the median local household income ($70k/yr) (locally 4052% of renters already pay >50% of income on rent) — very limited rent-growth headroom before tenants either downsize or default.
Questions for listing agent
- It's been on market 277 days. Have you received any prior offers? Is the seller open to a 12% concession, seller financing, or rate buy-down credit?
- Built in 1976 — when were the roof, HVAC, electrical panel, plumbing, and water heater last replaced?
- What does the HOA fee cover, when was the last increase, and are there any pending special assessments or reserve-fund shortfalls?
- Any open or pending special assessments — roof, HVAC, plumbing, elevator, façade? What's the per-unit balance and payoff schedule, and is the seller paying it off at close or rolling it to the buyer?
- Why hasn't it sold? Are there any deal-killer items the seller is aware of (foundation, flood, title, zoning, code violations)?
- Is there a deadline driving the sale (1031 exchange, divorce, estate, relocation)? That informs how much negotiation room exists.
- Schools are A-rated — typically a magnet for longer-tenancy family renters. What's the average tenant stay here, and is there a school-zone premium baked into asking?
- What's the average days-on-market for RENTAL listings here right now (not sales)? A rising rental-DOM trend means longer vacancies and softer asking-rent achievability than the comps imply.
CashFlowRE · CFR-B305BX8R7A32MT
· Data 4 days ago
cashflowre.app · 2026-05-29