710 Washington Ave #323 · Miami Beach, FL
Flood risk No data
- FEMA flood zone
- —
- Chance of flooding over 30 yrs
- —
- Est. flood insurance / yr
- —
Fire risk No data
- Est. fire insurance / yr
- —
Heat risk No data
- Hot days now (above threshold)
- —
- Hot days in 30 yrs
- —
Wind risk No data
- Chance of severe wind over 30 yrs
- —
Air-quality risk No data
- Unhealthy air days now
- —
- Unhealthy air days in 30 yrs
- —
Risk factors via First Street. Map © Google.
Why this score? — see what drove the C- grade
The composite is a weighted blend of 9 inputs, each scored 0–100. Each bar is that input's sub-score; the figure is the points it added to the 100-point composite (weight × sub-score).
- Cash flow +17.5/30.0
- ARV discount +7.5/15.0
- 1% rule +7.3/10.0
- DSCR +5.5/10.0
- Schools +4.2/10.0
- Livability +4.0/5.0
- Appreciation +3.9/10.0
- Condition / age +2.5/5.0
- Rent growth +2.4/5.0
$264,000
🖨 Deal sheet (PDF) 📄 Offer letter ✓ Due diligence
Listing remarks MLS
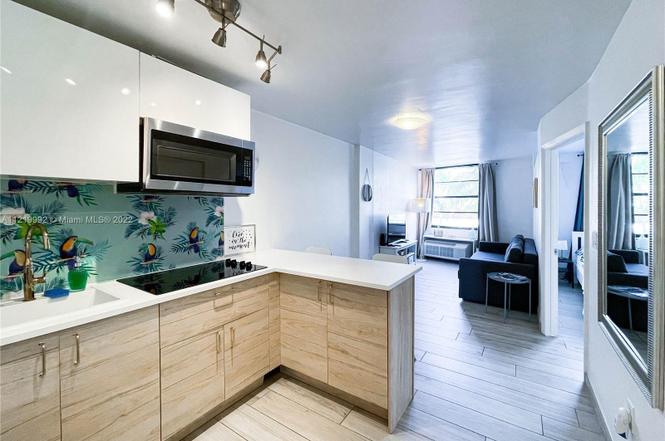
Fully furnished junior one bedroom in the center of South Beach. Location is everything. It's just steps to the ocean, shops, restaurants, night life, and all the perks of the beach lifestyle. Residence features a privacy wall making it a functional one bedroom with an open kitchenette, walk through closet, and plenty of natural light. The building has secure entry and laundry room with restaurants and shops on the ground floor. Great investment property with a 30 day minimum rental period and up to 12 times a year allowed.
Key facts
- $580 HOA
- Built 1976
- Listed 277 days
Property features AI
Finance
- Financial info: Pets allowed with size limit — maximum 20 lbs
- HOA & community: Monthly association fee of $580; HOA covers common areas and structure maintenance; Building elevator amenity
Exterior
- Parking: On-street parking
- Security: Secured elevator; Key card entry
- Utilities: Cooling available (wall/window units)
- Home design: Condominium with property attached; Faces east; Entry on level 2; 5-story building; Effective year built
- Construction: Brick construction
- Exterior features: No listed exterior features
Interior
- Kitchen: Gas range; Refrigerator
- Flooring: Tile
- Bathrooms: 1 full bathroom
- Heating & cooling: Wall/window cooling units
- Interior features: Furnished; First-floor entry; Other interior features
Neighborhood map
What this means for you Summary
Snapshot
- This is a 1-bed/1.0-bath condo listed at $264k.
Deal economics
- At list price, monthly cash flow is $205 ($2k/yr) — positive.
- The deal already cash-flows at list — no discount required.
- Meets the 1% rule at list price ($3k rent vs $264k).
- Recommended offer: $232k (12.0% below list) — sets the bar for market timing.
- Cap rate 7.2% vs local median 1.5% in Miami Beach — top-decile yield for the area; either an underpriced asset or a hidden risk that comps aren't pricing in. Stress-test before assuming the spread holds.
Location & tenants
- Location reads 80/100 on livability (#108 in FL, #1,672 nationally) — a professional / high-income tenant draw. Strengths: crime A+, commute A+, health & safety A+; Watch: housing C-, amenities D-, cost of living F.
- Miami-Dade (suburban): math 45% / reading 54% proficiency, ranked #40 of 73 in FL (top 55%) — families likely to look elsewhere, expect single-tenant / working-renter base with shorter leases; 64% free/reduced lunch — lower-income household profile, screen leases tightly.
- Market conditions: Rents soft (-0.4%/yr); 1214 active listings in the ZIP; 10,051 units permitted in Miami-Dade County in 2024 (7,758 in 5+ unit buildings).
- At $3,258/mo this rent would consume 56% of the median local household income ($70k/yr) (locally 4052% of renters already pay >50% of income on rent) — very limited rent-growth headroom before tenants either downsize or default.
Forward outlook
- Local home prices are declining (-2.2%/yr); year-one equity from $2k of loan paydown is wiped out by about $6k of value loss. Plan a longer hold.
- Miami-Dade County population projected at +28% by 2050 — long-run rental-demand tailwind backs the buy-and-hold thesis.
Negotiation context
- It's been on market 277 days — a 12% lower offer ($232k) is reasonable based on typical stale-listing flexibility.
- 12 sale attempts since 11y ago with the ask held roughly flat each time — persistent listings suggest the price (not the market) is what's stuck; bring a comps-based counter.
- Current owner paid $225k; 17% above their basis — modest negotiation headroom, anchor on the comps not their cost.
Questions for the listing agent
- It's been on market 277 days. Have you received any prior offers? Is the seller open to a 12% concession, seller financing, or rate buy-down credit?
- Built in 1976 — when were the roof, HVAC, electrical panel, plumbing, and water heater last replaced?
- What does the HOA fee cover, when was the last increase, and are there any pending special assessments or reserve-fund shortfalls?
- Any open or pending special assessments — roof, HVAC, plumbing, elevator, façade? What's the per-unit balance and payoff schedule, and is the seller paying it off at close or rolling it to the buyer?
- Why hasn't it sold? Are there any deal-killer items the seller is aware of (foundation, flood, title, zoning, code violations)?
- Is there a deadline driving the sale (1031 exchange, divorce, estate, relocation)? That informs how much negotiation room exists.
- Schools are A-rated — typically a magnet for longer-tenancy family renters. What's the average tenant stay here, and is there a school-zone premium baked into asking?
- What's the average days-on-market for RENTAL listings here right now (not sales)? A rising rental-DOM trend means longer vacancies and softer asking-rent achievability than the comps imply.
- What's the recent tenant-quality profile in this submarket — average credit score on applications, eviction rate, late-payment / NSF rate, and stable-employment percentage? A property-management company in the area should have these aggregated.
- How much new apartment / multifamily construction is in the pipeline within 1–3 miles? Heavy new supply (>2% of stock underway) typically softens rents 12–24 months out; light construction supports rent growth.
Investment metrics
- 1% rule
- 1.23% ✓
- Cap rate
- 7.23%
- Cash-on-cash
- 3.33%
- DSCR
- 1.15
- GRM
- 6.8
CMA / ARV
No comps found within radius.
Projected returns pro-forma
-2.19% appreciation · 0.0% rent growth · sell at horizon
- IRR
- -10.7%
- Equity multiple
- 0.60×
- Total profit
- $-29,794
- Equity at exit
- $49,021
- IRR
- -7.8%
- Equity multiple
- 0.51×
- Total profit
- $-36,435
- Equity at exit
- $39,766
Cash invested: $73,920 (down + closing). Projections, not guarantees.
Landlord ↔ Tenant lean methodology
- Overall (STATE)
- 87 Strongly Landlord-Friendly
- State Florida
- 87 Strongly Landlord-Friendly · R+3
- County
- — inherits STATE
- City
- — inherits STATE
ZIP-level market 33139
- Home prices YoY
- -0.8%
- Rents YoY
- -0.4%
- Active inventory
- 1214
- Price-to-rent
- 6.8×
Monthly cashflow live
- Estimated rent
- $3,258 medium interval (Pro) →
- Mortgage (P&I)
- −$1,384
- Tax from tax record
- −$294 /mo · $3,530/yr
- Insurance
- −$110
- HOA
- −$580
- Vacancy / Maint / Mgmt
- −$684
- Net cashflow
- $205
Break-even live
Sensitivity live
| Price | -10% $355 | -5% $280 | +0% $205 | +5% $131 | +10% $56 |
|---|---|---|---|---|---|
| Rent | -10% $-52 | -5% $77 | +0% $205 | +5% $334 | +10% $463 |
| Rate | -1.0pp $338 | -0.5pp $272 | base $205 | +0.5pp $137 | +1.0pp $67 |
UW: 25.0% down · 7.5% · 30yr · 1.5% tax · 5.0% vac · 8.0% maint · 8.0% mgmt
Financing live
Cash to close
- Down payment
- $66,000
- Closing costs
- $7,920
- Reserves months
- —
- Total cash needed
- —
Loan-product check · same deal, 3 products live
Conventional
25% down · 7.5% · 30yr
- Down + closing
- —
- Monthly P&I
- —
- Monthly cashflow
- —
- DSCR
- —
- Eligible?
- —
Personal DTI + credit; lowest rate.
DSCR
20% down · 8.5% · 30yr
- Down + closing
- —
- Monthly P&I
- —
- Monthly cashflow
- —
- DSCR
- —
- Eligible?
- —
No personal income docs; deal must DSCR.
Hard money
10% down · 12.0% · 12mo
- Down + closing
- —
- Monthly P&I
- —
- Monthly cashflow
- —
- DSCR
- —
- Eligible?
- —
Short-term bridge; refi at stabilization.
HOA detail condo
- Monthly dues
- $580 · $6,960/yr
- Assessments
- None detected in remarks — confirm with the listing agent.
Listing history 50 events
-
2026-06-17days on market $264,000 Active 277 DOM
-
2026-06-16days on market $264,000 Active 276 DOM
-
2026-06-15days on market $264,000 Active 275 DOM
-
2026-06-13days on market $264,000 Active 273 DOM
-
2026-06-09days on market $264,000 Active 269 DOM
-
2026-06-08days on market $264,000 Active 268 DOM
-
2026-06-08days on market $264,000 Active 267 DOM
-
2026-06-04days on market $264,000 Active 264 DOM
-
2026-06-03days on market $264,000 Active 263 DOM
-
2026-06-02days on market $264,000 Active 262 DOM
-
2026-06-01days on market $264,000 Active 261 DOM
-
2026-05-31days on market $264,000 Active 260 DOM
-
2026-04-17status Active
-
2026-01-18historical
-
2026-01-10status Active
-
2025-05-23$264,000 Active
-
2025-05-08historical
-
2024-12-18$264,000 Active
-
2024-12-12historical $2,000
-
2024-12-08historical
-
2024-10-31price $2,000
-
2024-10-30price $2,050
-
2024-10-25price $2,100
-
2024-10-23price $2,125
-
2024-10-17$2,125
-
2024-10-02historical $2,125
-
2024-09-28price $2,125
-
2024-09-14price $2,150
-
2024-09-10price $2,200
-
2024-08-02price $2,250
-
2024-07-27$2,300
-
2022-08-11soldstatus $225,000
-
2022-08-08soldstatus $225,000 Closed 529-char remark
Show marketing remark (529 chars)
Fully furnished junior one bedroom in the center of South Beach. Location is everything. It's just steps to the ocean, shops, restaurants, night life, and all the perks of the beach lifestyle. Residence features a privacy wall making it a functional one bedroom with an open kitchenette, walk through closet, and plenty of natural light. The building has secure entry and laundry room with restaurants and shops on the ground floor. Great investment property with a 30 day minimum rental period and up to 12 times a year allowed.
-
2022-07-05historical Active Under Contract 529-char remark
Show marketing remark (529 chars)
Fully furnished junior one bedroom in the center of South Beach. Location is everything. It's just steps to the ocean, shops, restaurants, night life, and all the perks of the beach lifestyle. Residence features a privacy wall making it a functional one bedroom with an open kitchenette, walk through closet, and plenty of natural light. The building has secure entry and laundry room with restaurants and shops on the ground floor. Great investment property with a 30 day minimum rental period and up to 12 times a year allowed.
-
2022-06-09$225,000 Active 529-char remark
Show marketing remark (529 chars)
Fully furnished junior one bedroom in the center of South Beach. Location is everything. It's just steps to the ocean, shops, restaurants, night life, and all the perks of the beach lifestyle. Residence features a privacy wall making it a functional one bedroom with an open kitchenette, walk through closet, and plenty of natural light. The building has secure entry and laundry room with restaurants and shops on the ground floor. Great investment property with a 30 day minimum rental period and up to 12 times a year allowed.
-
2021-04-13soldstatus $188,000
-
2021-03-26soldstatus $188,000 Closed
-
2021-03-24historical Active Under Contract
-
2020-11-29$199,000 Active
-
2020-10-31historical
-
2020-07-21price $189,000
-
2020-05-21price $195,000
-
2020-03-25$199,000 Active
-
2019-01-28soldstatus $142,000
-
2019-01-18soldstatus $142,000 Sold
-
2018-11-02status Pending
-
2018-01-25price $159,000
-
2018-01-25status Active
-
2017-11-09historical
-
2017-07-18$170,000 Active
ⓘ Source: listings_history table (triggers on properties + properties_extension) + one-shot
backfill from property_details.listing_events for pre-trigger history.
Tax reassessment forecast FL · Resets to sale price
- Current annual tax
- $3,530 · $294/mo
- Projected year-2 tax
- $3,530 · $294/mo
- Expected delta
- $0/yr ($0/mo · 0.0%)
ⓘ Screening estimate from a state-policy table — verify with the county assessor before closing.
Nearby sold comps map
Loading sold comps map…
Walkable amenities ~0.75 mi
Loading nearby amenities…
Taxation est. · year 1
- Rental income
- $39,097
- − Mortgage interest
- −$14,788
- − Property taxes
- −$3,530
- − Insurance
- −$1,320
- − Repairs & maintenance
- −$3,128
- − Management
- −$3,128
- − HOA
- −$6,960
- − Depreciation
- −$7,680
- Taxable loss
- −$1,437
- Est. tax savings @ 24.0%
- +$345
- After-tax cash flow
- $2,808/yr
For passive investors: Depreciation is non-cash, so a rental often shows a tax loss while cash-flowing — sheltering income. Rental losses are passive: they offset passive income freely, and up to $25,000/yr can offset ordinary (W-2) income if you actively participate and your MAGI is under $100k (phasing out to $0 by $150k); unused losses carry forward. On sale, claimed depreciation is recaptured at up to 25%, and gains may owe capital-gains tax (a 1031 exchange can defer both). Figures are a year-1 estimate at your 24.0% rate — not tax advice; consult a CPA.
Schools (NCES district)
- District
- Miami-Dade
- NCES district ID
- 1200390
- Math proficiency
- 45% ▼ -16.00%
- Reading proficiency
- 54% ▼ -5.00%
- Median HH income
- $43,928
- Composite
- 41.76/100
- National rank
- #3397
- State rank
- #40 of 73 in FL
Livability — Miami Beach
- Score
- 80/100
- State rank
- #108
- US rank
- #1672
Category grades
Schools grade is shown separately in the Schools card above.
Census & demographics
- Census place
- Miami Beach, FL
- County
- Miami-Dade County · 2,697,751 people
- City population
- 90,533
- Metro
- Miami-Fort Lauderdale-Pompano Beach, FL
- Population (ZIP)
- 33,753
- Household income
- $69,793
- Rent vs Own
- Severe rent burden
- 4052.0
Population outlook (Miami-Dade County) Hauer SSP2
- Today (2025)
- 3,126,439 people
- By 2030
- 3,325,765 · +6.4%
- By 2040
- 3,697,561 · +18.3%
- By 2050
- 4,012,134 · +28.3%
- By 2075
- 4,605,612 · +47.3%
- By 2100
- 4,866,598 · +55.7%
Race, ethnicity, and origin ACS 2023
- Neighborhood character
- Diverse neighborhood (Simpson 0.58)
- Race & ethnicity
- Hispanic / Latino 51% White 40% Two or more races 17% Black 4% Asian 3%
- Hispanic origin (detail)
- Mexican 2% Puerto Rican 2% Cuban 15% Salvadoran 3%
- Common ancestry
- Lithuanian 3% Scotch-Irish 2% Romanian 2%
- Foreign-born
- 56% · Canada, Jamaica, Dominican Republic
- Languages at home
- 37% English-only · Spanish 49% Other Indo-European 5% French/Haitian/Cajun 3%
Political lean MEDSL · Miami-Dade
- 2024 margin
- R (+11.4) · D 43.9% · R 55.4%
- 2008→2024 swing
- -27.6pp toward R · 2008: 16.1pp · 2024: -11.4pp
- All cycles
- 2024: R+11.4 2020: D+7.3 2016: D+29.6 2012: D+23.7 2008: D+16.1
Not yet ingested
- Civics
- —
Market trends
- HPI YoY
- ▼ -2.19%
- Current HPI
- 277.9321
- Rent YoY
- ▼ -0.36%
- Metro
- Miami-Fort Lauderdale-Pompano Beach, FL
- State GDP YoY
- ▲ 3.28%
- F500 in state
- 36
Industry mix (Fortune 500 HQ in FL)
| Industry | F500 HQs | Revenue |
|---|---|---|
| Industrial Technology | 2 | $29B |
|
||
| Insurance | 2 | $17B |
|
||
| Retail | 1 | $60B |
|
||
| Technology Distribution | 1 | $58B |
|
||
| Homebuilding | 1 | $35B |
|
||
| Technology Manufacturing | 1 | $35B |
|
||
Price history
+412.6% since first listed46 events — show timeline
- 2026-04-17 Relisted — MARMLS
- 2026-01-18 Listing Removed — MARMLS
- 2026-01-10 Relisted — MARMLS
- 2025-05-23 Listed $264,000 MARMLS
- 2025-05-08 Listing Removed — MARMLS
- 2024-12-18 Listed $264,000 MARMLS
- 2024-12-12 Rental Removed $2,000 MARMLS
- 2024-12-08 Coming Soon — MARMLS
- 2024-10-31 Price Changed $2,000 MARMLS
- 2024-10-30 Price Changed $2,050 MARMLS
- 2024-10-25 Price Changed $2,100 MARMLS
- 2024-10-23 Price Changed $2,125 MARMLS
- 2024-10-17 Listed for Rent $2,125 MARMLS
- 2024-10-02 Rental Removed $2,125 MARMLS
- 2024-09-28 Price Changed $2,125 MARMLS
- 2024-09-14 Price Changed $2,150 MARMLS
- 2024-09-10 Price Changed $2,200 MARMLS
- 2024-08-02 Price Changed $2,250 MARMLS
- 2024-07-27 Listed for Rent $2,300 MARMLS
- 2022-08-11 Sold (Public Records) $225,000 Public Records
- 2022-08-08 Sold (MLS) $225,000 MARMLS
- 2022-07-05 Contingent — MARMLS
- 2022-06-09 Listed $225,000 MARMLS
- 2021-04-13 Sold (Public Records) $188,000 Public Records
- 2021-03-26 Sold (MLS) $188,000 MARMLS
- 2021-03-24 Contingent — MARMLS
- 2020-11-29 Listed $199,000 MARMLS
- 2020-10-31 Listing Removed — MARMLS
- 2020-07-21 Price Changed $189,000 MARMLS
- 2020-05-21 Price Changed $195,000 MARMLS
- 2020-03-25 Listed $199,000 MARMLS
- 2019-01-28 Sold (Public Records) $142,000 Public Records
- 2019-01-18 Sold (MLS) $142,000 MARMLS
- 2018-11-02 Pending — MARMLS
- 2018-01-25 Price Changed $159,000 MARMLS
- 2018-01-25 Relisted — MARMLS
- 2017-11-09 Listing Removed — MARMLS
- 2017-07-18 Listed $170,000 MARMLS
- 2017-07-01 Listing Removed — MARMLS
- 2015-12-11 Listed $205,000 MARMLS
- 2009-12-08 Sold (Public Records) $85,000 Public Records
- 2009-11-25 Sold (MLS) $85,000 MARMLS
- 2004-01-21 Sold (Public Records) $89,900 Public Records
- 2000-09-14 Sold (Public Records) $60,000 Public Records
- 1997-12-09 Sold (Public Records) $53,000 Public Records
- 1993-09-01 Sold (Public Records) $51,500 Public Records
Property tax history
+7.0%/yrLatest (2025): $3,530 · -0.3% YoY. Source: county tax records.
Cash-flow waterfall
monthlySold comps — $/sqft
last 12 mo · ≤1 miLoading sold comps…