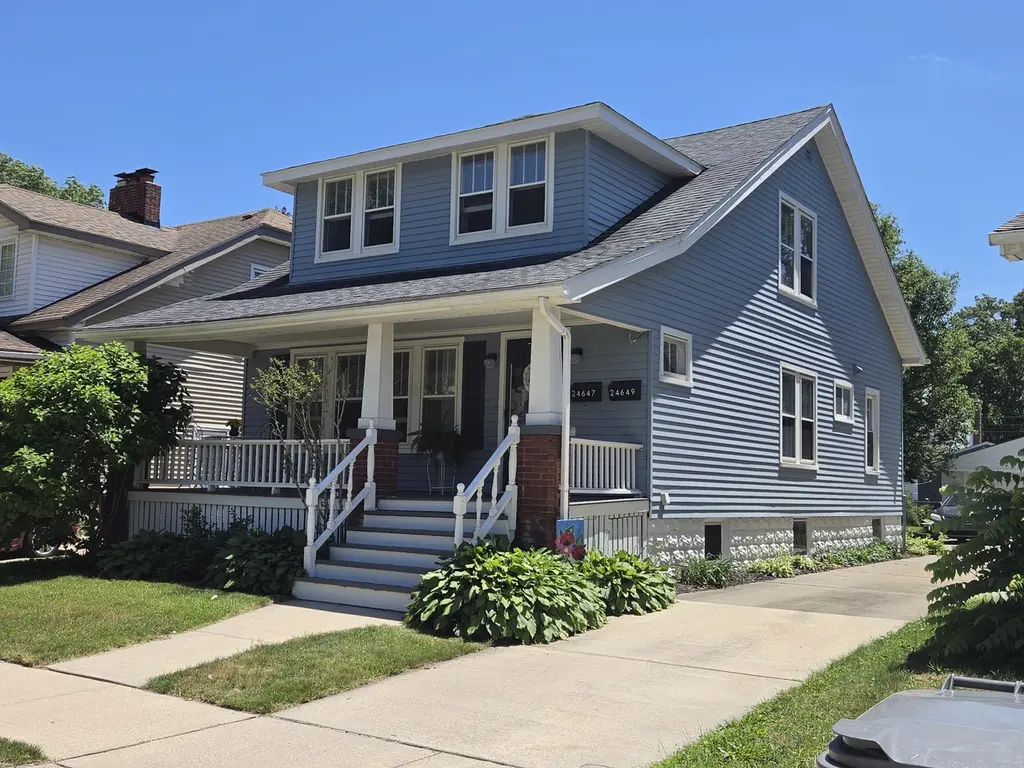
24647 Dunning St
Dearborn, MI 48124
$264,900C
3 bd · 2.0 ba ·
1,512 sqft ·
Built 1925
· MultiFamily
· Active
· 2 DOM
Cashflow @ list (25.0% down · 7.5%)
Estimated rent
$3,260/mo
Mortgage (P&I)
−$1,389
Tax + insurance
−$356
HOA
−$0
Vac / Maint / Mgmt
−$685
Net cashflow
$831/mo
Annual
$9,967/yr
Cap rate
10.06%
Cash-on-cash
13.44%
DSCR
1.60
1% rule
1.23%
Cash to close
$74,172
Investor read
- This is a 2 × 3-bed/2.0-bath units multifamily listed at $265k.
- At list price, monthly cash flow is $831 ($10k/yr) — positive. Per door: $415/mo.
- The deal already cash-flows at list — no discount required.
- Meets the 1% rule at list price ($3k rent vs $265k).
- Only 2 days on market — expect competitive offers; lowballing is unlikely to land.
- Local home prices are declining (-3.0%/yr); year-one equity from $2k of loan paydown is wiped out by about $8k of value loss. Plan a longer hold.
- Location reads 80/100 on livability (#84 in MI, #1,904 nationally) — a professional / high-income tenant draw. Strengths: commute A+, cost of living A+, housing A+; Watch: amenities D, schools D-.
- Dearborn City School District (urban): math 26% / reading 39% proficiency, ranked #325 of 540 in MI (top 60%) — families likely to look elsewhere, expect single-tenant / working-renter base with shorter leases; 66% free/reduced lunch — lower-income household profile, screen leases tightly.
- Watch-outs: built in 1925 — expect roof / HVAC / electrical / plumbing capex.
- Market conditions: Rents rising (+3.6%/yr); 148 active listings in the ZIP; 11 comparable units currently listed for rent nearby; rentals leasing fast (median 2d on market — plan ~1-2 weeks tenant-placement turnaround); solid renter incomes; 2,639 units permitted in Wayne County in 2024 (1,216 in 5+ unit buildings).
- Wayne County population projected at -17% by 2050 — secular population decline; favor cash flow + early exit over multi-decade hold.
- 2 sale attempts with the ask held roughly flat each time — persistent listings suggest the price (not the market) is what's stuck; bring a comps-based counter.
- At projected returns (-3.0% appreciation + 3.6% rent growth), your $74k cash investment doubles in ~9 years — after that, you're playing with house money.
- Cap rate 10.1% vs local median 4.3% in Dearborn — top-decile yield for the area; either an underpriced asset or a hidden risk that comps aren't pricing in. Stress-test before assuming the spread holds.
- At $3,260/mo this rent would consume 48% of the median local household income ($82k/yr) (locally 444% of renters already pay >50% of income on rent) — very limited rent-growth headroom before tenants either downsize or default.
Questions for listing agent
- Can we see the unit-by-unit rent roll, current vacancy, and any below-market leases? What's the average tenancy length?
- What capital expenditures (roof, boiler, parking lot, exteriors) have been made in the last 5 years, and what's planned in the next 2?
- Built in 1925 — when were the roof, HVAC, electrical panel, plumbing, and water heater last replaced?
- Is there a deadline driving the sale (1031 exchange, divorce, estate, relocation)? That informs how much negotiation room exists.
- Schools are D-rated, which usually means shorter tenancies and higher turnover. Who's the typical renter profile here, and what's been the actual vacancy rate?
- What's the average days-on-market for RENTAL listings here right now (not sales)? A rising rental-DOM trend means longer vacancies and softer asking-rent achievability than the comps imply.
- What's the recent tenant-quality profile in this submarket — average credit score on applications, eviction rate, late-payment / NSF rate, and stable-employment percentage? A property-management company in the area should have these aggregated.
- How much new apartment / multifamily construction is in the pipeline within 1–3 miles? Heavy new supply (>2% of stock underway) typically softens rents 12–24 months out; light construction supports rent growth.
CashFlowRE · CFR-B398ZF2Y37AT8K
· Data 2 days ago
cashflowre.app · 2026-05-29