 Duplex
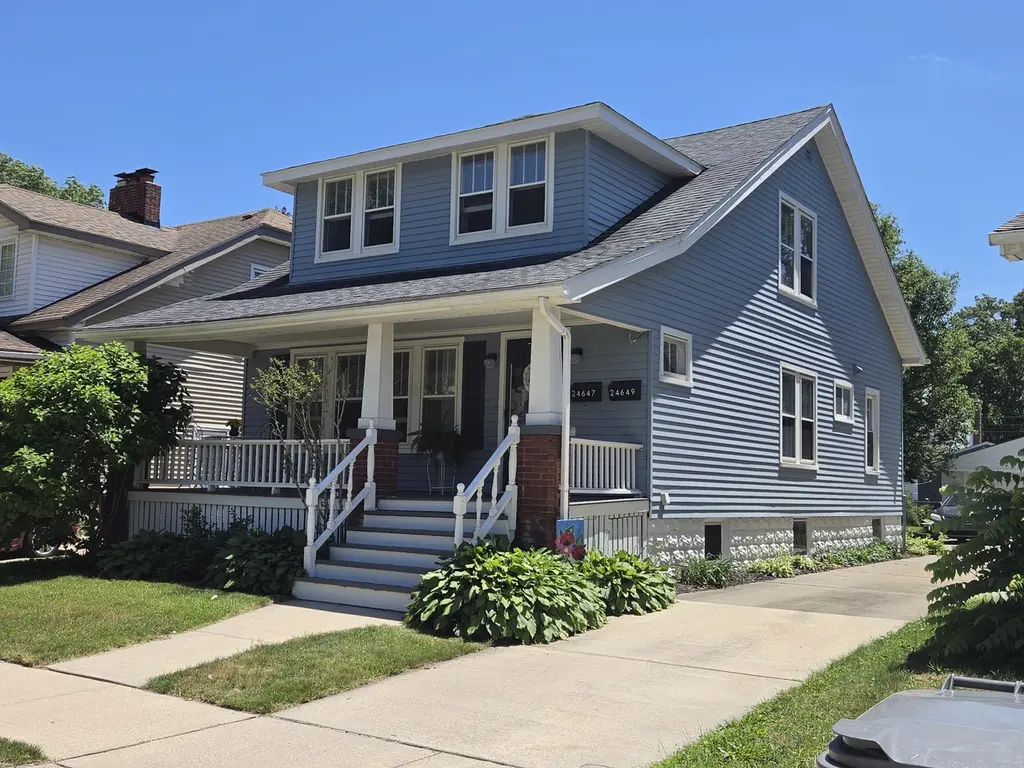
24647 Dunning St · Dearborn, MI
Flood risk 1/10 · Minimal
- FEMA flood zone
- X (unshaded)
- Chance of flooding over 30 yrs
- 0.0%
- Est. flood insurance / yr
- $473 – $860
Fire risk 1/10 · Minimal
- Est. fire insurance / yr
- $784 – $1,456
Heat risk 3/10 · Minor
- Hot days now (above 98°F)
- 7 days/yr
- Hot days in 30 yrs
- 15 days/yr
Wind risk 2/10 · Minimal
- Chance of severe wind over 30 yrs
- —
Air-quality risk 2/10 · Minimal
- Unhealthy air days now
- 1 days/yr
- Unhealthy air days in 30 yrs
- 2 days/yr
Risk factors via First Street. Map © Google.
Why this score? — see what drove the C grade
The composite is a weighted blend of 9 inputs, each scored 0–100. Each bar is that input's sub-score; the figure is the points it added to the 100-point composite (weight × sub-score).
- Cash flow +28.1/30.0
- DSCR +10.0/10.0
- 1% rule +7.3/10.0
- Livability +4.0/5.0
- Rent growth +3.4/5.0
- Schools +2.8/10.0
- Condition / age +2.5/5.0
- ARV discount +0.0/15.0
- Appreciation +0.0/10.0
$264,900
🖨 Deal sheet 📄 Offer letter ✓ Due diligence
Multi-family units
County records classify this as Multi-Family (2-4 Unit). Listing-text estimate: 2 units. confirmed
Listing remarks MLS
Timeless Dearborn Duplex, $2800/Month Rent Potential. Certificate of occupancy complete. Step back in time without sacrificing today's comforts. Nestled on a quiet west Dearborn street one block from a lush city park and within easy walking distance of a top-rated school, this rare 2 family home is more than an investment-it's a piece of Dearborn's storied heritage. Built in an era when craftsmen took pride in every nail and joist, this 2 story duplex exudes a warmth and permanence that modern construction simply cant replicate. From the moment you arrive you'll notice the sturdy solid structure, the deep front porch begging for morning coffee, the designs whispering stories of the roaring 20s. Its a lovingly maintained home that has stood the test of time; Now upgraded for decades more of worry-free ownership. Upgrades that matter, not just lipstick; Newer roof, updated Elecrical, Copper Plumbing, fully finished basement. The #S make sense or live in 1 & pay off the loan w/ othe
Key facts
- Top-rated school
- Newer roof
- Deep front porch
Tags
Property features AI
Finance
- Financial info: Annual taxes reported
Exterior
- Parking: 6 parking spaces on concrete surface
- Utilities: Public water; Public sewer; Electricity connected; Natural gas connected; Cable connected
- Home design: Residential income property (multi-family)
- Construction: Aluminum siding and block construction
- Exterior features: Public maintained road; Sidewalks
Interior
- Bedrooms: Lower unit: 2 bedrooms; Upper unit: 1 bedroom (upper level, with dryer hookup)
- Bathrooms: Lower unit: 1 bathroom; Upper unit: 1 bathroom
- Heating & cooling: Forced air heating; Natural gas heating
- Interior features: Full basement; Basement laundry area in common space
- Laundry & utility: Common area laundry located in the basement; Upper unit includes dryer hookup
Neighborhood map
What this means for you Summary
Snapshot
- This is a 2 × 3-bed/2.0-bath units multifamily listed at $265k.
Deal economics
- At list price, monthly cash flow is $831 ($10k/yr) — positive. Per door: $415/mo.
- The deal already cash-flows at list — no discount required.
- Meets the 1% rule at list price ($3k rent vs $265k).
- Cap rate 10.1% vs local median 4.3% in Dearborn — top-decile yield for the area; either an underpriced asset or a hidden risk that comps aren't pricing in. Stress-test before assuming the spread holds.
Location & tenants
- Location reads 80/100 on livability (#84 in MI, #1,904 nationally) — a professional / high-income tenant draw. Strengths: commute A+, cost of living A+, housing A+; Watch: amenities D, schools D-.
- Dearborn City School District (urban): math 26% / reading 39% proficiency, ranked #325 of 540 in MI (top 60%) — families likely to look elsewhere, expect single-tenant / working-renter base with shorter leases; 66% free/reduced lunch — lower-income household profile, screen leases tightly.
- Market conditions: Rents rising (+3.6%/yr); 148 active listings in the ZIP; 11 comparable units currently listed for rent nearby; rentals leasing fast (median 2d on market — plan ~1-2 weeks tenant-placement turnaround); solid renter incomes; 2,639 units permitted in Wayne County in 2024 (1,216 in 5+ unit buildings).
- At $3,260/mo this rent would consume 48% of the median local household income ($82k/yr) (locally 444% of renters already pay >50% of income on rent) — very limited rent-growth headroom before tenants either downsize or default.
Forward outlook
- Local home prices are declining (-3.0%/yr); year-one equity from $2k of loan paydown is wiped out by about $8k of value loss. Plan a longer hold.
- Wayne County population projected at -17% by 2050 — secular population decline; favor cash flow + early exit over multi-decade hold.
- At projected returns (-3.0% appreciation + 3.6% rent growth), your $74k cash investment doubles in ~9 years — after that, you're playing with house money.
Negotiation context
- Only 2 days on market — expect competitive offers; lowballing is unlikely to land.
- 2 sale attempts with the ask held roughly flat each time — persistent listings suggest the price (not the market) is what's stuck; bring a comps-based counter.
Risks & watch-outs
- Watch-outs: built in 1925 — expect roof / HVAC / electrical / plumbing capex.
Questions for the listing agent
- Can we see the unit-by-unit rent roll, current vacancy, and any below-market leases? What's the average tenancy length?
- What capital expenditures (roof, boiler, parking lot, exteriors) have been made in the last 5 years, and what's planned in the next 2?
- Built in 1925 — when were the roof, HVAC, electrical panel, plumbing, and water heater last replaced?
- Is there a deadline driving the sale (1031 exchange, divorce, estate, relocation)? That informs how much negotiation room exists.
- Schools are D-rated, which usually means shorter tenancies and higher turnover. Who's the typical renter profile here, and what's been the actual vacancy rate?
- What's the average days-on-market for RENTAL listings here right now (not sales)? A rising rental-DOM trend means longer vacancies and softer asking-rent achievability than the comps imply.
- What's the recent tenant-quality profile in this submarket — average credit score on applications, eviction rate, late-payment / NSF rate, and stable-employment percentage? A property-management company in the area should have these aggregated.
- How much new apartment / multifamily construction is in the pipeline within 1–3 miles? Heavy new supply (>2% of stock underway) typically softens rents 12–24 months out; light construction supports rent growth.
Investment metrics
- 1% rule
- 1.23% ✓
- Cap rate
- 10.06%
- Cash-on-cash
- 13.44%
- DSCR
- 1.60
- GRM
- 6.8
CMA / ARV
- ARV (on-the-fly)
- $182,952
- Comps found
- 1
Show comp detail 1 sale within ~0.75 mi
| Address | Dist | Beds/Ba | Sqft | Sold | Price | $/sf | Match |
|---|---|---|---|---|---|---|---|
| 24823 Dunning St | 0.07mi | 3/2.0 | 1,575 (+4%) | 16mo | $190,000 | $121 | 77 |
Match score weights: distance 35% · size 25% · config 20% · recency 20%. Top-matched comps best support the ARV.
Projected returns pro-forma
-3.0% appreciation · 3.57% rent growth · sell at horizon
- IRR
- 4.1%
- Equity multiple
- 1.16×
- Total profit
- $11,850
- Equity at exit
- $39,497
- IRR
- 14.1%
- Equity multiple
- 2.16×
- Total profit
- $86,224
- Equity at exit
- $22,904
Cash invested: $74,172 (down + closing). Projections, not guarantees.
Landlord ↔ Tenant lean methodology
- Overall (STATE)
- 62 Landlord-Friendly
- State Michigan
- 62 Landlord-Friendly · EVEN
- County
- — inherits STATE
- City
- — inherits STATE
ZIP-level market 48124
- Rents YoY
- 3.6%
- Active inventory
- 148
- Price-to-rent
- 13.5×
Monthly cashflow live
- Estimated rent
- $3,260 high interval (Pro) →
- Mortgage (P&I)
- −$1,389
- Tax from tax record
- −$245 /mo · $2,944/yr
- Insurance
- −$110
- HOA
- −$0
- Vacancy / Maint / Mgmt
- −$685
- Net cashflow
- $831
Break-even live
2-unit breakdown (identical units grouped — click to expand)
| Units | Beds | Baths | Est. rent |
|---|---|---|---|
| 2× units | 3 | 2 | $3,260 |
| #1 | 3 | 2 | $1,630 |
| #2 | 3 | 2 | $1,630 |
| Total (2 units) | $3,260 | ||
UW: 25.0% down · 7.5% · 30yr · 1.5% tax · 5.0% vac · 8.0% maint · 8.0% mgmt
Financing live
Cash to close
- Down payment
- $66,225
- Closing costs
- $7,947
- Reserves months
- —
- Total cash needed
- —
Loan-product check · same deal, 3 products live
Conventional
25% down · 7.5% · 30yr
- Down + closing
- —
- Monthly P&I
- —
- Monthly cashflow
- —
- DSCR
- —
- Eligible?
- —
Personal DTI + credit; lowest rate.
DSCR
20% down · 8.5% · 30yr
- Down + closing
- —
- Monthly P&I
- —
- Monthly cashflow
- —
- DSCR
- —
- Eligible?
- —
No personal income docs; deal must DSCR.
Hard money
10% down · 12.0% · 12mo
- Down + closing
- —
- Monthly P&I
- —
- Monthly cashflow
- —
- DSCR
- —
- Eligible?
- —
Short-term bridge; refi at stabilization.
Rent comps 11 comps
| Address | Beds | Baths | Sqft | Rent | $/sqft | DOM | Units | Dist |
|---|---|---|---|---|---|---|---|---|
| 24926 Hickory St Dearborn, MI | 3.0 | 1.0 | 2040 | $1,800 | $0.88 | 1d | 1 | 0.20mi |
| 24738 New York St Dearborn, MI | 3.0 | 1.0 | 1296 | $1,800 | $1.39 | 2d | 1 | 0.27mi |
| 25745 Princeton St Dearborn Heights, MI | 3.0 | 1.0 | 1080 | $1,500 | $1.39 | 10d | 1 | 0.61mi |
| 24601 Andover Dr Dearborn Heights, MI | 3.0 | 1.5 | 1092 | $1,700 | $1.56 | 1d | 1 | 0.80mi |
| 2823 Queen St Dearborn, MI | 3.0 | 2.0 | 1400 | $1,599 | $1.14 | 18d | 1 | 0.82mi |
| 3901 Academy St Dearborn Heights, MI | 4.0 | 2.0 | 1400 | $2,100 | $1.50 | 1d | 1 | 1.01mi |
| 572 Tobin Dr Inkster, MI | 1.0–3.0 | 1.0–2.0 | 936 | $1,600 | $1.71 | 1d | 22 | 1.27mi |
| 26159 Stanford St Inkster, MI | 4.0 | 1.0 | 1056 | $1,350 | $1.28 | 5d | 1 | 1.28mi |
| 25699 Pennie St Dearborn Heights, MI | 3.0 | 1.0 | 1699 | $1,600 | $0.94 | 1d | 1 | 1.41mi |
| 3620 Monroe St Dearborn, MI | 3.0 | 2.0 | 1100 | $1,800 | $1.64 | 10d | 1 | 1.45mi |
| 26274 McDonald St Dearborn Heights, MI | 3.0 | 1.0 | 1365 | $1,575 | $1.15 | 1d | 1 | 1.50mi |
Listing history 3 events
-
2026-06-18days on market $264,900 Active 2 DOM
-
2026-06-17remarks 699-char remark
-
2026-06-17$264,900 Active 1 DOM
ⓘ Source: listings_history table (triggers on properties + properties_extension) + one-shot
backfill from property_details.listing_events for pre-trigger history.
Tax reassessment forecast MI · Partial reset (capped growth)
- Current annual tax
- $2,944 · $245/mo
- Projected year-2 tax
- $3,512 · $293/mo
- Expected delta
- +$568/yr (+$47/mo · 19.3%)
ⓘ Screening estimate from a state-policy table — verify with the county assessor before closing.
Climate risk First Street
- Flood 1/10 Low FEMA zone X (unshaded) · 0% chance over 30 yrs
- Wildfire 1/10 Low
- Heat 3/10 Moderate 7 d/yr ≥98°F today · 15 d/yr by 30 yrs out
- Wind 2/10 Low
- Air quality 2/10 Low 1 unhealthy d/yr today · 2 by 30 yrs out
Nearby sold comps map
Loading sold comps map…
Walkable amenities ~0.75 mi
Loading nearby amenities…
Taxation est. · year 1
- Rental income
- $39,120
- − Mortgage interest
- −$14,839
- − Property taxes
- −$2,944
- − Insurance
- −$1,324
- − Repairs & maintenance
- −$3,130
- − Management
- −$3,130
- − Depreciation
- −$7,706
- Taxable income
- $6,048
- Est. tax owed @ 24.0%
- −$1,451
- After-tax cash flow
- $8,515/yr
For passive investors: Depreciation is non-cash, so a rental often shows a tax loss while cash-flowing — sheltering income. Rental losses are passive: they offset passive income freely, and up to $25,000/yr can offset ordinary (W-2) income if you actively participate and your MAGI is under $100k (phasing out to $0 by $150k); unused losses carry forward. On sale, claimed depreciation is recaptured at up to 25%, and gains may owe capital-gains tax (a 1031 exchange can defer both). Figures are a year-1 estimate at your 24.0% rate — not tax advice; consult a CPA.
Schools (NCES district)
- District
- Dearborn City School District
- NCES district ID
- 2611600
- Math proficiency
- 26% ▼ -14.00%
- Reading proficiency
- 39% ▼ -8.00%
- Median HH income
- $46,884
- Composite
- 27.93/100
- National rank
- #6864
- State rank
- #325 of 540 in MI
Livability — Dearborn
- Score
- 80/100
- State rank
- #84
- US rank
- #1904
Category grades
Schools grade is shown separately in the Schools card above.
Census & demographics
- Census place
- Dearborn, MI
- County
- Wayne County · 1,562,939 people
- City population
- 86,476
- Metro
- Detroit-Warren-Dearborn, MI
- Population (ZIP)
- 34,479
- Household income
- $81,796
- Rent vs Own
- Severe rent burden
- 444.0
Population outlook (Wayne County) Hauer SSP2
- Today (2025)
- 1,675,273 people
- By 2030
- 1,620,300 · -3.3%
- By 2040
- 1,502,341 · -10.3%
- By 2050
- 1,384,039 · -17.4%
- By 2075
- 1,124,592 · -32.9%
- By 2100
- 881,193 · -47.4%
Race, ethnicity, and origin ACS 2023
- Neighborhood character
- Predominantly White (84%)
- Race & ethnicity
- White 84% Two or more races 7% Hispanic / Latino 5% Black 4%
- Hispanic origin (detail)
- Mexican 3%
- Common ancestry
- Romanian 12% Lithuanian 4% Slovak 3%
- Foreign-born
- 10% · Canada
- Languages at home
- 82% English-only · Arabic 12% Spanish 2% Other Indo-European 2%
Political lean MEDSL · Wayne
- 2024 margin
- Strong D (+29.0) · D 62.7% · R 33.7% · Other 3.6%
- 2008→2024 swing
- -20.5pp toward R · 2008: 49.5pp · 2024: 29.0pp
- All cycles
- 2024: D+29.0 2020: D+38.1 2016: D+37.3 2012: D+46.9 2008: D+49.5
Not yet ingested
- Civics
- —
Market trends
- HPI YoY
- ▼ -278.39%
- Current HPI
- 204.5229
- Rent YoY
- ▲ 3.57%
- Metro
- Detroit-Warren-Dearborn, MI
- State GDP YoY
- ▲ 1.37%
- F500 in state
- 28
Industry mix (Fortune 500 HQ in MI)
| Industry | F500 HQs | Revenue |
|---|---|---|
| Automotive Parts | 3 | $48B |
|
||
| Automotive | 2 | $372B |
|
||
| Chemicals | 1 | $45B |
|
||
| Automotive Retail | 1 | $29B |
|
||
| Healthcare / Medical Devices | 1 | $23B |
|
||
| Automotive Technology | 1 | $20B |
|
||
Price history
+0.0% since first listed2 events — show timeline
- 2026-06-16 Listed $264,900 REALCOMP
- 2026-06-16 Listed $264,900 MiRealSource-MiMLS
Property tax history
+3.1%/yrLatest (2025): $2,944 · -0.3% YoY. Source: county tax records.
Cash-flow waterfall
monthlySold comps — $/sqft
last 12 mo · ≤1 miLoading sold comps…