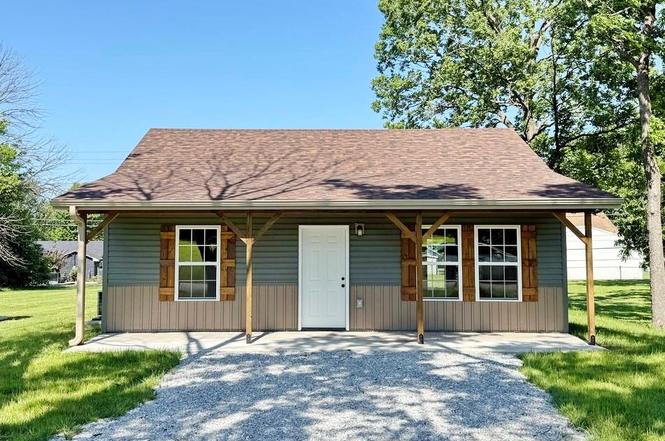
904 S Kirkpatrick St
El Dorado Springs, MO 64744
$125,900C+
2 bd · 1.0 ba ·
875 sqft ·
Built 2025
· SingleFamily
· Active
· 170 DOM
Cashflow @ list (25.0% down · 7.5%)
Estimated rent
$1,450/mo
Mortgage (P&I)
−$660
Tax + insurance
−$210
HOA
−$0
Vac / Maint / Mgmt
−$304
Net cashflow
$275/mo
Annual
$3,305/yr
Cap rate
8.92%
Cash-on-cash
9.38%
DSCR
1.42
1% rule
1.15%
Cash to close
$35,252
Investor read
- This is a 2-bed/1.0-bath single-family listed at $126k.
- At list price, monthly cash flow is $275 ($3k/yr) — positive.
- The deal already cash-flows at list — no discount required.
- Meets the 1% rule at list price ($1k rent vs $126k).
- It's been on market 170 days — a 12% lower offer ($111k) is reasonable based on typical stale-listing flexibility.
- Recommended offer: $111k (12.0% below list) — sets the bar for market timing.
- In year one you build about $13k of equity ($870 loan paydown + $13k appreciation (10.0% local appreciation)).
- Location reads 62/100 on livability (#370 in MO) — a middle-class / working-renter tenant base. Strengths: cost of living A+, housing A+, health & safety A+; Watch: schools D-, amenities F, commute F.
- El Dorado Springs R-II (town): math 25% / reading 34% proficiency, ranked #279 of 324 in MO (top 86%) — low school quality limits family demand, transient renter base, plan for 1-2y turnover.
- Market conditions: 81 active listings in the ZIP; 1 comparable units currently listed for rent nearby; 4 units permitted in Cedar County in 2024 (0 in 5+ unit buildings).
- Cedar County population projected at -12% by 2050 — secular population decline; favor cash flow + early exit over multi-decade hold.
- 2 sale attempts with the ask held roughly flat each time — persistent listings suggest the price (not the market) is what's stuck; bring a comps-based counter.
- At projected returns (10.0% appreciation + 3.0% rent growth), your $35k cash investment doubles in ~3 years — after that, you're playing with house money.
- By year 3, paydown + projected appreciation supports a ~$34k cash-out refi (75% LTV) — recoverable capital for the next deal without selling this one.
- Cap rate 8.9% vs local median 4.9% in El Dorado Springs — top-decile yield for the area; either an underpriced asset or a hidden risk that comps aren't pricing in. Stress-test before assuming the spread holds.
Questions for listing agent
- It's been on market 170 days. Have you received any prior offers? Is the seller open to a 12% concession, seller financing, or rate buy-down credit?
- Why hasn't it sold? Are there any deal-killer items the seller is aware of (foundation, flood, title, zoning, code violations)?
- Is there a deadline driving the sale (1031 exchange, divorce, estate, relocation)? That informs how much negotiation room exists.
- Schools are D-rated, which usually means shorter tenancies and higher turnover. Who's the typical renter profile here, and what's been the actual vacancy rate?
- What's the average days-on-market for RENTAL listings here right now (not sales)? A rising rental-DOM trend means longer vacancies and softer asking-rent achievability than the comps imply.
- What's the recent tenant-quality profile in this submarket — average credit score on applications, eviction rate, late-payment / NSF rate, and stable-employment percentage? A property-management company in the area should have these aggregated.
- How much new for-sale + rental construction is in the pipeline within 1–3 miles? Heavy new supply typically softens prices + rents 12–24 months out; constrained supply supports both.
CashFlowRE · CFR-B3DVVC7P6E1X6S
· Data 2 days ago
cashflowre.app · 2026-05-29