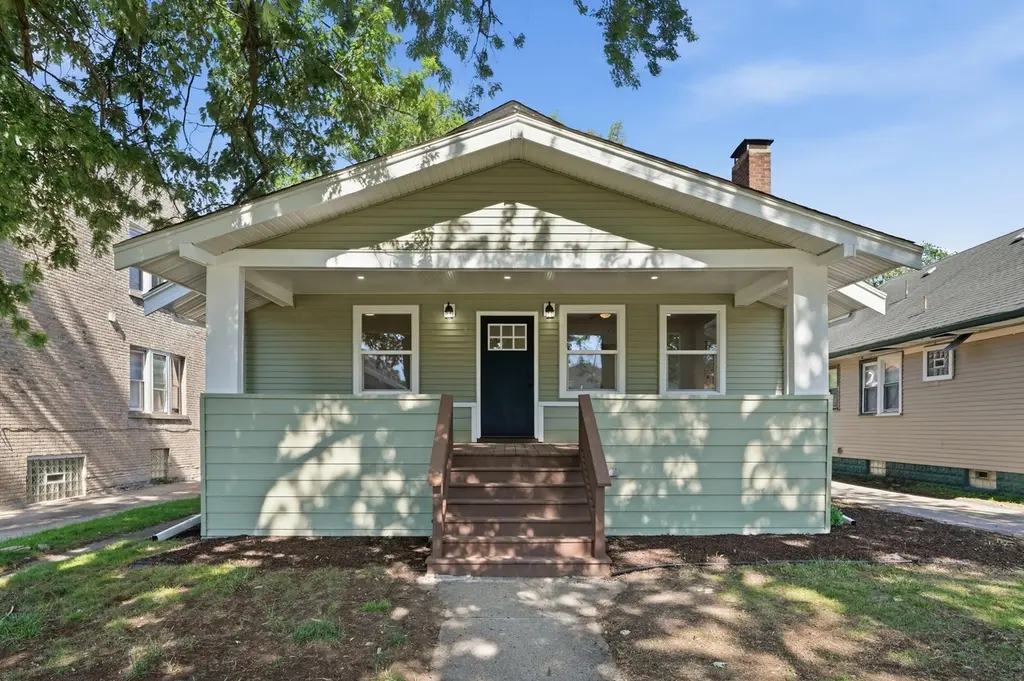
5959 Hyslop Pl
Hammond, IN 46320
$264,900F
3 bd · 1.0 ba ·
1,378 sqft ·
Built 1915
· SingleFamily
· Active
· 9 DOM
Cashflow @ list (25.0% down · 7.5%)
Estimated rent
$1,534/mo
Mortgage (P&I)
−$1,389
Tax + insurance
−$220
HOA
−$0
Vac / Maint / Mgmt
−$322
Net cashflow
$-397/mo
Annual
$-4,765/yr
Cap rate
4.49%
Cash-on-cash
-6.42%
DSCR
0.71
1% rule
0.58%
Cash to close
$74,172
Investor read
- This is a 3-bed/1.0-bath single-family listed at $265k.
- At list price, monthly cash flow is $-397 ($-5k/yr) — negative.
- To cash-flow at today's rent, offer at most $195k (26.5% below list).
- To meet the 1% rule (rent ≥ 1% of price), the offer needs to be $153k (42.1% below list).
- Only 9 days on market — expect competitive offers; lowballing is unlikely to land.
- Recommended offer: $153k (42.1% below list) — sets the bar for 1% rule.
- In year one you build about $28k of equity ($2k loan paydown + $26k appreciation (10.0% local appreciation)).
- Location reads 70/100 on livability (#143 in IN) — a middle-class / working-renter tenant base. Strengths: cost of living A+, housing A+, commute A; Watch: health & safety D+, employment D, schools F.
- School City Of Hammond (suburban): math 8% / reading 18% proficiency, ranked #289 of 301 in IN (top 96%) — low school quality limits family demand, transient renter base, plan for 1-2y turnover; 74% free/reduced lunch — lower-income household profile, screen leases tightly.
- Watch-outs: built in 1915 — expect roof / HVAC / electrical / plumbing capex.
- Market conditions: Rents rising fast (+7.6%/yr); 52 active listings in the ZIP; 11 comparable units currently listed for rent nearby; rentals at typical pace (median 15d on market — plan ~3-4 weeks tenant-placement turnaround); lower-income renter base — watch delinquency; 1,642 units permitted in Lake County in 2024 (14 in 5+ unit buildings).
- Lake County population projected to shrink 7% by 2050 — rents likely to lag national; underwrite the cash flow, not the appreciation.
- By year 2, paydown + projected appreciation supports a ~$46k cash-out refi (75% LTV) — recoverable capital for the next deal without selling this one.
- Cap rate 4.5% vs local median 5.8% in Hammond — below-typical yield; the buyer is paying a premium for something (appreciation thesis, condition, location) that the cap rate doesn't capture.
- At $1,534/mo this rent would consume 50% of the median local household income ($37k/yr) (locally 900% of renters already pay >50% of income on rent) — very limited rent-growth headroom before tenants either downsize or default.
Questions for listing agent
- What do current leases actually rent for vs. the listed asking? Can we see a recent rent roll and the last 12 months of T-12 income?
- Built in 1915 — when were the roof, HVAC, electrical panel, plumbing, and water heater last replaced?
- Is there a deadline driving the sale (1031 exchange, divorce, estate, relocation)? That informs how much negotiation room exists.
- Schools are F-rated, which usually means shorter tenancies and higher turnover. Who's the typical renter profile here, and what's been the actual vacancy rate?
- Crime grade is F in this area — have there been break-ins, vandalism, or insurance claims at this property in the last 3 years? What carrier currently insures it and at what premium?
- The area grade is low — what's the realistic commute time and amenity access for the typical tenant pool here? Any planned neighborhood developments (good or bad) we should know about?
- What's the average days-on-market for RENTAL listings here right now (not sales)? A rising rental-DOM trend means longer vacancies and softer asking-rent achievability than the comps imply.
- What's the recent tenant-quality profile in this submarket — average credit score on applications, eviction rate, late-payment / NSF rate, and stable-employment percentage? A property-management company in the area should have these aggregated.
CashFlowRE · CFR-B4SXT02R97BECA
· Data 2 days ago
cashflowre.app · 2026-05-29