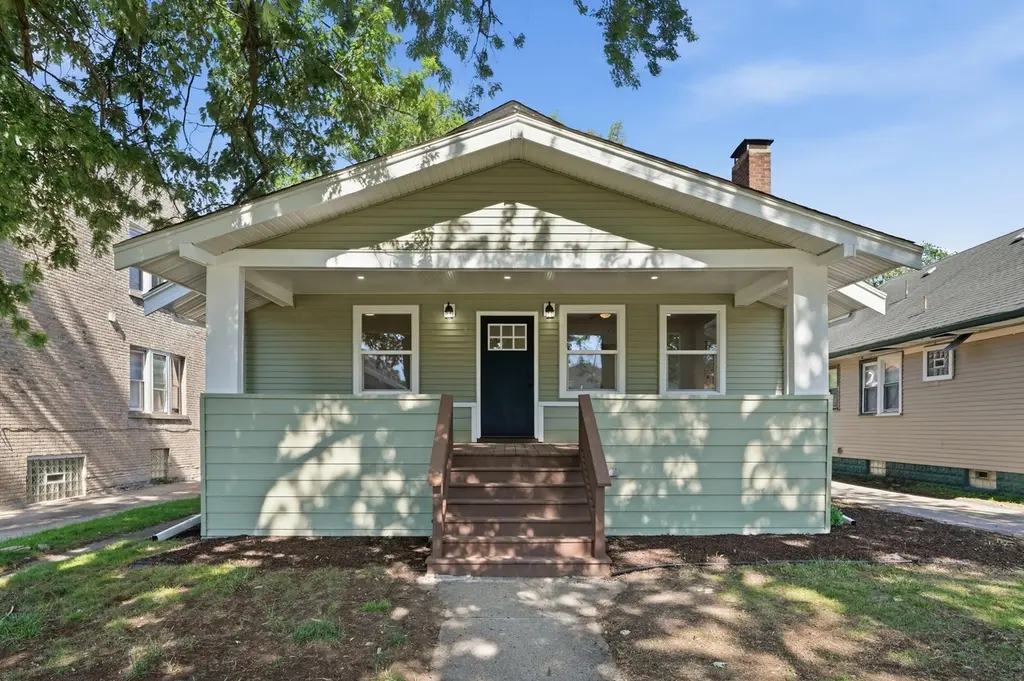
5959 Hyslop Pl · Hammond, IN
Flood risk 1/10 · Minimal
- FEMA flood zone
- X (unshaded)
- Chance of flooding over 30 yrs
- 0.0%
- Est. flood insurance / yr
- $473 – $860
Fire risk 1/10 · Minimal
- Est. fire insurance / yr
- $717 – $1,331
Heat risk 3/10 · Minor
- Hot days now (above 102°F)
- 7 days/yr
- Hot days in 30 yrs
- 15 days/yr
Wind risk 2/10 · Minimal
- Chance of severe wind over 30 yrs
- 0.0%
Air-quality risk 4/10 · Minor
- Unhealthy air days now
- 5 days/yr
- Unhealthy air days in 30 yrs
- 6 days/yr
Risk factors via First Street. Map © Google.
Why this score? — see what drove the F grade
The composite is a weighted blend of 9 inputs, each scored 0–100. Each bar is that input's sub-score; the figure is the points it added to the 100-point composite (weight × sub-score).
- Appreciation +10.0/10.0
- Cash flow +6.9/30.0
- Rent growth +4.4/5.0
- Livability +3.5/5.0
- Condition / age +2.5/5.0
- DSCR +1.1/10.0
- Schools +1.1/10.0
- 1% rule +0.8/10.0
- ARV discount +0.0/15.0
$264,900
🖨 Deal sheet 📄 Offer letter ✓ Due diligence
Key facts
- 6,500 sq ft lot
- 2 garage spots
- Built 1915
Property features AI
Exterior
- Parking: Driveway; 2-car garage
- Utilities: Public water; Public sewer
- Home design: Built in 1915; One level
- Construction: Year built 1915
- Exterior features: Neighborhood view; Lot size per assessor
Interior
- Kitchen: Dishwasher; Stainless steel appliances; Refrigerator; Microwave; Gas range
- Bedrooms: Primary bedroom; Three additional bedrooms; Bonus room
- Bathrooms: 1 full bathroom; 1 three-quarter bathroom
- Heating & cooling: Forced air heating; Central air conditioning
- Interior features: Kitchen island; Stone counters; Recessed lighting; Finished full basement; Living room fireplace (1)
Neighborhood map
What this means for you Summary
Snapshot
- This is a 3-bed/1.0-bath single-family listed at $265k.
Deal economics
- At list price, monthly cash flow is $-397 ($-5k/yr) — negative.
- To cash-flow at today's rent, offer at most $195k (26.5% below list).
- To meet the 1% rule (rent ≥ 1% of price), the offer needs to be $153k (42.1% below list).
- Recommended offer: $153k (42.1% below list) — sets the bar for 1% rule.
- Cap rate 4.5% vs local median 5.8% in Hammond — below-typical yield; the buyer is paying a premium for something (appreciation thesis, condition, location) that the cap rate doesn't capture.
Location & tenants
- Location reads 70/100 on livability (#143 in IN) — a middle-class / working-renter tenant base. Strengths: cost of living A+, housing A+, commute A; Watch: health & safety D+, employment D, schools F.
- School City Of Hammond (suburban): math 8% / reading 18% proficiency, ranked #289 of 301 in IN (top 96%) — low school quality limits family demand, transient renter base, plan for 1-2y turnover; 74% free/reduced lunch — lower-income household profile, screen leases tightly.
- Market conditions: Rents rising fast (+7.6%/yr); 52 active listings in the ZIP; 11 comparable units currently listed for rent nearby; rentals at typical pace (median 15d on market — plan ~3-4 weeks tenant-placement turnaround); lower-income renter base — watch delinquency; 1,642 units permitted in Lake County in 2024 (14 in 5+ unit buildings).
- At $1,534/mo this rent would consume 50% of the median local household income ($37k/yr) (locally 900% of renters already pay >50% of income on rent) — very limited rent-growth headroom before tenants either downsize or default.
Forward outlook
- In year one you build about $28k of equity ($2k loan paydown + $26k appreciation (10.0% local appreciation)).
- Lake County population projected to shrink 7% by 2050 — rents likely to lag national; underwrite the cash flow, not the appreciation.
- By year 2, paydown + projected appreciation supports a ~$46k cash-out refi (75% LTV) — recoverable capital for the next deal without selling this one.
Negotiation context
- Only 9 days on market — expect competitive offers; lowballing is unlikely to land.
Risks & watch-outs
- Watch-outs: built in 1915 — expect roof / HVAC / electrical / plumbing capex.
Questions for the listing agent
- What do current leases actually rent for vs. the listed asking? Can we see a recent rent roll and the last 12 months of T-12 income?
- Built in 1915 — when were the roof, HVAC, electrical panel, plumbing, and water heater last replaced?
- Is there a deadline driving the sale (1031 exchange, divorce, estate, relocation)? That informs how much negotiation room exists.
- Schools are F-rated, which usually means shorter tenancies and higher turnover. Who's the typical renter profile here, and what's been the actual vacancy rate?
- Crime grade is F in this area — have there been break-ins, vandalism, or insurance claims at this property in the last 3 years? What carrier currently insures it and at what premium?
- The area grade is low — what's the realistic commute time and amenity access for the typical tenant pool here? Any planned neighborhood developments (good or bad) we should know about?
- What's the average days-on-market for RENTAL listings here right now (not sales)? A rising rental-DOM trend means longer vacancies and softer asking-rent achievability than the comps imply.
- What's the recent tenant-quality profile in this submarket — average credit score on applications, eviction rate, late-payment / NSF rate, and stable-employment percentage? A property-management company in the area should have these aggregated.
- How much new for-sale + rental construction is in the pipeline within 1–3 miles? Heavy new supply typically softens prices + rents 12–24 months out; constrained supply supports both.
Investment metrics
- 1% rule
- 0.58% ✗
- Cap rate
- 4.49%
- Cash-on-cash
- -6.42%
- DSCR
- 0.71
- GRM
- 14.4
CMA / ARV
- ARV (on-the-fly)
- $195,676
- Comps found
- 12
Show comp detail 12 sales within ~0.75 mi
| Address | Dist | Beds/Ba | Sqft | Sold | Price | $/sf | Match |
|---|---|---|---|---|---|---|---|
| 244 Condit St | 0.54mi | 3/2.0 | 1,397 (+1%) | 1mo | $293,500 | $210 | 68 |
| 212 Ruth St | 0.56mi | 3/2.0 | 1,305 (-5%) | 1mo | $216,000 | $166 | 60 |
| 106 Elizabeth St | 0.39mi | 3/1.5 | 1,507 (+9%) | 7mo | $172,250 | $114 | 58 |
| 802 State Line Rd | 0.49mi | 4/3.0 (+1) | 1,400 (+2%) | 9mo | $85,000 | $61 | 54 |
| 131 Detroit St | 0.46mi | 2/1.5 (-1) | 1,527 (+11%) | 2mo | $175,000 | $115 | 51 |
| 301 Warren St | 0.67mi | 3/2.0 | 1,270 (-8%) | 2mo | $211,000 | $166 | 50 |
| 817 Becker St | 0.68mi | 4/2.0 (+1) | 1,363 (-1%) | 10mo | $112,000 | $82 | 49 |
| 106 Forestdale Pkwy | 0.43mi | 4/3.0 (+1) | 1,519 (+10%) | 6mo | $126,500 | $83 | 45 |
| 37 Waltham St | 0.35mi | 4/2.0 (+1) | 1,559 (+13%) | 11mo | $239,000 | $153 | 44 |
| 904 Field St | 0.74mi | 4/1.0 (+1) | 1,250 (-9%) | 4mo | $221,400 | $177 | 42 |
| 1007 Wentworth Ave | 0.47mi | 2/2.0 (-1) | 1,200 (-13%) | 7mo | $170,000 | $142 | 41 |
| 256 Florence St | 0.72mi | 2/1.0 (-1) | 1,548 (+12%) | 10mo | $180,000 | $116 | 32 |
Match score weights: distance 35% · size 25% · config 20% · recency 20%. Top-matched comps best support the ARV.
Projected returns pro-forma
10.0% appreciation · 7.61% rent growth · sell at horizon
- IRR
- 20.8%
- Equity multiple
- 2.70×
- Total profit
- $126,311
- Equity at exit
- $238,643
- IRR
- 19.8%
- Equity multiple
- 6.52×
- Total profit
- $409,792
- Equity at exit
- $514,642
Cash invested: $74,172 (down + closing). Projections, not guarantees.
Landlord ↔ Tenant lean methodology
- Overall (STATE)
- 90 Strongly Landlord-Friendly
- State Indiana
- 90 Strongly Landlord-Friendly · R+11
- County
- — inherits STATE
- City
- — inherits STATE
ZIP-level market 46320
- Home prices YoY
- 5.0%
- Rents YoY
- 7.6%
- Active inventory
- 52
- Price-to-rent
- 14.4×
Monthly cashflow live
- Estimated rent
- $1,534 high interval (Pro) →
- Mortgage (P&I)
- −$1,389
- Tax from tax record
- −$109 /mo · $1,310/yr
- Insurance
- −$110
- HOA
- −$0
- Vacancy / Maint / Mgmt
- −$322
- Net cashflow
- $-397
Break-even live
UW: 25.0% down · 7.5% · 30yr · 1.5% tax · 5.0% vac · 8.0% maint · 8.0% mgmt
Financing live
Cash to close
- Down payment
- $66,225
- Closing costs
- $7,947
- Reserves months
- —
- Total cash needed
- —
Loan-product check · same deal, 3 products live
Conventional
25% down · 7.5% · 30yr
- Down + closing
- —
- Monthly P&I
- —
- Monthly cashflow
- —
- DSCR
- —
- Eligible?
- —
Personal DTI + credit; lowest rate.
DSCR
20% down · 8.5% · 30yr
- Down + closing
- —
- Monthly P&I
- —
- Monthly cashflow
- —
- DSCR
- —
- Eligible?
- —
No personal income docs; deal must DSCR.
Hard money
10% down · 12.0% · 12mo
- Down + closing
- —
- Monthly P&I
- —
- Monthly cashflow
- —
- DSCR
- —
- Eligible?
- —
Short-term bridge; refi at stabilization.
Rent comps 11 comps
| Address | Beds | Baths | Sqft | Rent | $/sqft | DOM | Units | Dist |
|---|---|---|---|---|---|---|---|---|
| 3 Waltham St Hammond, IN | 3.0 | 1.0 | 1200 | $1,095 | $0.91 | 24d | 1 | 0.28mi |
| 5 Ruth St Unit 2W Hammond, IN | 2.0 | 1.0 | 900 | $1,250 | $1.39 | 12d | 1 | 0.30mi |
| 3 Ruth St Hammond, IN | 2.0 | 1.0 | 900 | $1,250 | $1.39 | 24d | 1 | 0.30mi |
| 34 Elizabeth St Calumet City, IL | 3.0 | 1.0 | 1246 | $2,400 | $1.93 | 1d | 1 | 0.36mi |
| 407 Kenwood St Hammond, IN | 2.0 | 1.0 | 920 | $1,495 | $1.62 | 24d | 1 | 0.40mi |
| 407 Kenwood St Hammond, IN | 2.0 | 1.0 | 920 | $1,495 | $1.62 | 16d | 1 | 0.40mi |
| 1312 Gordon Ave Calumet City, IL | 2.0 | 1.0 | 1134 | $1,600 | $1.41 | 7d | 1 | 1.01mi |
| 323 Memorial Dr Unit 2 Calumet City, IL | 2.0 | 1.0 | 1000 | $1,600 | $1.60 | 24d | 1 | 1.19mi |
| 1539 Wentworth Ave Unit 3W Calumet City, IL | 3.0 | 1.0 | 1100 | $1,700 | $1.55 | 12d | 1 | 1.22mi |
| 1344 Michigan St Hammond, IN | 3.0 | 1.0 | 1006 | $1,595 | $1.59 | 15d | 1 | 1.38mi |
| 1454 Sherman St Hammond, IN | 3.0 | 1.0 | 960 | $1,400 | $1.46 | 3d | 1 | 1.38mi |
Listing history 5 events
-
2026-06-18days on market $264,900 Active 9 DOM
-
2026-06-17days on market $264,900 Active 8 DOM
-
2026-06-16days on market $264,900 Active 7 DOM
-
2026-06-15statusdays on market $264,900 Active 6 DOM
-
2026-05-22$264,900 Active
ⓘ Source: listings_history table (triggers on properties + properties_extension) + one-shot
backfill from property_details.listing_events for pre-trigger history.
Tax reassessment forecast IN · Partial reset (capped growth)
- Current annual tax
- $1,310 · $109/mo
- Projected year-2 tax
- $1,781 · $148/mo
- Expected delta
- +$471/yr (+$39/mo · 36.0%)
ⓘ Screening estimate from a state-policy table — verify with the county assessor before closing.
Climate risk First Street
- Flood 1/10 Low FEMA zone X (unshaded) · 0% chance over 30 yrs
- Wildfire 1/10 Low
- Heat 3/10 Moderate 7 d/yr ≥102°F today · 15 d/yr by 30 yrs out
- Wind 2/10 Low 0% chance of damaging wind over 30 yrs
- Air quality 4/10 Moderate 5 unhealthy d/yr today · 6 by 30 yrs out
Nearby sold comps map
Loading sold comps map…
Walkable amenities ~0.75 mi
Loading nearby amenities…
Taxation est. · year 1
- Rental income
- $18,404
- − Mortgage interest
- −$14,839
- − Property taxes
- −$1,310
- − Insurance
- −$1,324
- − Repairs & maintenance
- −$1,472
- − Management
- −$1,472
- − Depreciation
- −$7,706
- Taxable loss
- −$9,720
- Est. tax savings @ 24.0%
- +$2,333
- After-tax cash flow
- $-2,432/yr
For passive investors: Depreciation is non-cash, so a rental often shows a tax loss while cash-flowing — sheltering income. Rental losses are passive: they offset passive income freely, and up to $25,000/yr can offset ordinary (W-2) income if you actively participate and your MAGI is under $100k (phasing out to $0 by $150k); unused losses carry forward. On sale, claimed depreciation is recaptured at up to 25%, and gains may owe capital-gains tax (a 1031 exchange can defer both). Figures are a year-1 estimate at your 24.0% rate — not tax advice; consult a CPA.
Schools (NCES district)
- District
- School City Of Hammond
- NCES district ID
- 1804320
- Math proficiency
- 8% ▼ -18.00%
- Reading proficiency
- 18% ▼ -15.00%
- Median HH income
- $39,970
- Composite
- 11.11/100
- National rank
- #9730
- State rank
- #289 of 301 in IN
Livability — Hammond
- Score
- 70/100
- State rank
- #143
- US rank
- #7343
Category grades
Schools grade is shown separately in the Schools card above.
Census & demographics
- Census place
- Hammond, IN
- County
- Lake County · 422,878 people
- City population
- 58,809
- Metro
- Chicago-Naperville-Elgin, IL-IN-WI
- Population (ZIP)
- 14,353
- Household income
- $37,158
- Rent vs Own
- Severe rent burden
- 900.0
Population outlook (Lake County) Hauer SSP2
- Today (2025)
- 484,026 people
- By 2030
- 478,091 · -1.2%
- By 2040
- 462,974 · -4.3%
- By 2050
- 449,894 · -7.1%
- By 2075
- 436,169 · -9.9%
- By 2100
- 426,607 · -11.9%
Race, ethnicity, and origin ACS 2023
- Neighborhood character
- Diverse neighborhood (Simpson 0.64)
- Race & ethnicity
- Black 44% Hispanic / Latino 39% White 14% Two or more races 12% Asian 1%
- Hispanic origin (detail)
- Mexican 31% Puerto Rican 4%
- Common ancestry
- Romanian 2% Lithuanian 1%
- Foreign-born
- 14% · Canada
- Languages at home
- 68% English-only · Spanish 31%
Political lean MEDSL · Lake
- 2024 margin
- Lean D (+5.6) · D 52.1% · R 46.5% · Other 1.5%
- 2008→2024 swing
- -28.6pp toward R · 2008: 34.3pp · 2024: 5.6pp
- All cycles
- 2024: D+5.6 2020: D+15.1 2016: D+20.6 2012: D+31.0 2008: D+34.3
Not yet ingested
- Civics
- —
Market trends
- HPI YoY
- ▲ 13.81%
- Current HPI
- 288.1513
- Rent YoY
- ▲ 7.61%
- Metro
- Chicago-Naperville-Elgin, IL-IN-WI
- State GDP YoY
- ▲ 2.90%
- F500 in state
- 18
Industry mix (Fortune 500 HQ in IN)
| Industry | F500 HQs | Revenue |
|---|---|---|
| Industrial Machinery | 2 | $37B |
|
||
| Healthcare | 1 | $177B |
|
||
| Pharmaceuticals | 1 | $45B |
|
||
| Metals / Steel | 1 | $18B |
|
||
| Agriculture | 1 | $17B |
|
||
| Packaging | 1 | $12B |
|
||
Price history
1 event — show timeline
- 2026-05-22 Listed $264,900 NIRA MLS as Distributed by MLS Grid
Property tax history
+34.3%/yrLatest (2024): $1,310 · +2.0% YoY. Source: county tax records.
Cash-flow waterfall
monthlySold comps — $/sqft
last 12 mo · ≤1 miLoading sold comps…