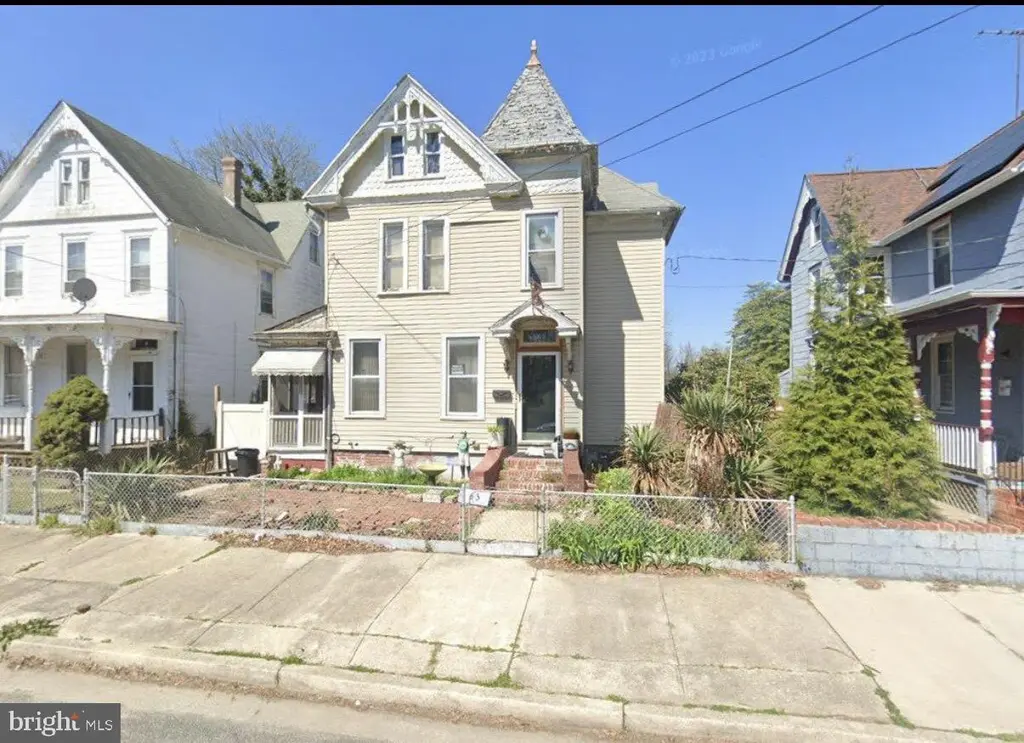
63 Seventh St
Salem, NJ 08079
$100,000B+
4 bd · 2.5 ba ·
2,441 sqft ·
Built 1925
· SingleFamily
· Pending
· 1 DOM
Cashflow @ list (25.0% down · 7.5%)
Estimated rent
$2,383/mo
Mortgage (P&I)
−$524
Tax + insurance
−$167
HOA
−$0
Vac / Maint / Mgmt
−$501
Net cashflow
$1,192/mo
Annual
$14,301/yr
Cap rate
20.59%
Cash-on-cash
51.08%
DSCR
3.27
1% rule
2.38%
Cash to close
$28,000
Investor read
- This is a 4-bed/2.5-bath single-family listed at $100k.
- At list price, monthly cash flow is $1k ($14k/yr) — positive.
- The deal already cash-flows at list — no discount required.
- Meets the 1% rule at list price ($2k rent vs $100k).
- Only 1 days on market — expect competitive offers; lowballing is unlikely to land.
- In year one you build about $311 of equity ($691 loan paydown + $-380 appreciation (-0.4% local appreciation)).
- Location reads 61/100 on livability (#462 in NJ) — a middle-class / working-renter tenant base. Strengths: cost of living A+, health & safety A+, crime B; Watch: amenities F, commute F, employment F.
- Salem City School District (town): math 6% / reading 24% proficiency, ranked #464 of 472 in NJ (top 98%) — low school quality limits family demand, transient renter base, plan for 1-2y turnover; 85% free/reduced lunch — lower-income household profile, screen leases tightly.
- Zoned schools: John Fenwick Academy (411 students, 77% FRL); Salem Middle School (math 2% / reading 21%, grade F, #423 of 431 statewide, top 98%, 487 students, 79% FRL); Salem High School (math 17% / reading 37%, grade F, #312 of 399 statewide, top 79%, 420 students, 52% FRL) — zoned schools average 69% FRL vs 85% district-wide (15 pts lower); this property's tenant base skews higher-income than the district average.
- Watch-outs: built in 1925 — expect roof / HVAC / electrical / plumbing capex.
- Market conditions: 103 active listings in the ZIP; 2 comparable units currently listed for rent nearby; 95 units permitted in Salem County in 2024 (0 in 5+ unit buildings).
- Salem County population projected at -23% by 2050 — secular population decline; favor cash flow + early exit over multi-decade hold.
- 5 sale attempts since 23y ago with the ask held roughly flat each time — persistent listings suggest the price (not the market) is what's stuck; bring a comps-based counter.
- Current owner paid $48k; list at $100k implies a 108% gain — meaningful room to come down on a strong offer.
- At projected returns (-0.4% appreciation + 3.0% rent growth), your $28k cash investment doubles in ~2 years — after that, you're playing with house money.
- Climate carrying-cost: moderate flood risk; major wind risk, 27% chance of damaging wind over 30y; extreme-heat days projected 7→15/yr by 2055 (HVAC capex compounding) — expect insurance premiums to compound above CPI over the hold.
- Cap rate 20.6% vs local median 8.1% in Salem — top-decile yield for the area; either an underpriced asset or a hidden risk that comps aren't pricing in. Stress-test before assuming the spread holds.
- At $2,383/mo this rent would consume 52% of the median local household income ($55k/yr) (locally 663% of renters already pay >50% of income on rent) — very limited rent-growth headroom before tenants either downsize or default.
Questions for listing agent
- Built in 1925 — when were the roof, HVAC, electrical panel, plumbing, and water heater last replaced?
- Is there a deadline driving the sale (1031 exchange, divorce, estate, relocation)? That informs how much negotiation room exists.
- Schools are D-rated, which usually means shorter tenancies and higher turnover. Who's the typical renter profile here, and what's been the actual vacancy rate?
- What's the average days-on-market for RENTAL listings here right now (not sales)? A rising rental-DOM trend means longer vacancies and softer asking-rent achievability than the comps imply.
- What's the recent tenant-quality profile in this submarket — average credit score on applications, eviction rate, late-payment / NSF rate, and stable-employment percentage? A property-management company in the area should have these aggregated.
- How much new for-sale + rental construction is in the pipeline within 1–3 miles? Heavy new supply typically softens prices + rents 12–24 months out; constrained supply supports both.
CashFlowRE · CFR-B5WJKS702WK3T9
· Data 4 weeks ago
cashflowre.app · 2026-05-29