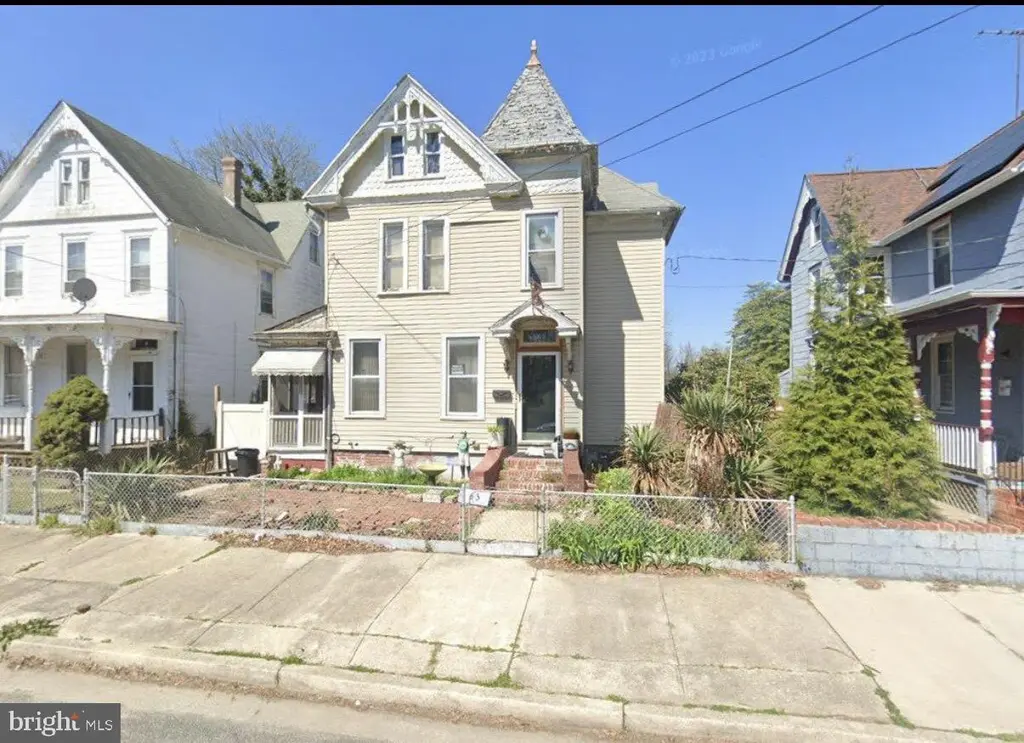
63 Seventh St · Salem, NJ
Flood risk 5/10 · Moderate
- FEMA flood zone
- X (unshaded)
- Chance of flooding over 30 yrs
- 0.22%
- Est. flood insurance / yr
- $507 – $1,088
Fire risk 1/10 · Minimal
- Est. fire insurance / yr
- $526 – $976
Heat risk 7/10 · Major
- Hot days now (above 103°F)
- 7 days/yr
- Hot days in 30 yrs
- 15 days/yr
Wind risk 6/10 · Moderate
- Chance of severe wind over 30 yrs
- 27.0%
Air-quality risk 3/10 · Minor
- Unhealthy air days now
- 2 days/yr
- Unhealthy air days in 30 yrs
- 4 days/yr
Risk factors via First Street. Map © Google.
Why this score? — see what drove the B+ grade
The composite is a weighted blend of 9 inputs, each scored 0–100. Each bar is that input's sub-score; the figure is the points it added to the 100-point composite (weight × sub-score).
- Cash flow +30.0/30.0
- ARV discount +15.0/15.0
- 1% rule +10.0/10.0
- DSCR +10.0/10.0
- Appreciation +4.8/10.0
- Livability +3.1/5.0
- Rent growth +2.5/5.0
- Condition / age +2.5/5.0
- Schools +1.2/10.0
$100,000
🖨 Deal sheet (PDF) 📄 Offer letter ✓ Due diligence
Listing remarks MLS
BANK OWNED PROPERTY! ALL OFFERS MUST HAVE PREQUAL & PROOF OF FUNDS! PROPERTY SOLD AS IS! ALL CERTS AND REPAIRS AND THE RESPONSIBILITY OF THE BUYER!!
Key facts
- 8,281 sq ft lot
- Built 1925
Property features AI
Finance
- Other: Pets allowed with no restrictions
- Financial info: Ground rent payment frequency: annually
Exterior
- Parking: Driveway
- Utilities: Public water; Public sewer
- Home design: Detached structure; Fee simple ownership
- Construction: Frame construction; Block foundation
- Exterior features: Long lot approximately 40 x 207; Not in a federal flood zone; Above-grade and below-grade structures
Interior
- Bedrooms: Three bedrooms on the first upper level; One bedroom on the second upper level
- Bathrooms: Two full bathrooms (all upper levels); One half bathroom on the main level
- Heating & cooling: 90% forced air heating; Window air conditioning units (electric)
- Interior features: Additional bedroom(s); Full basement
Neighborhood map
What this means for you Summary
Snapshot
- This is a 4-bed/2.5-bath single-family listed at $100k.
Deal economics
- At list price, monthly cash flow is $1k ($14k/yr) — positive.
- The deal already cash-flows at list — no discount required.
- Meets the 1% rule at list price ($2k rent vs $100k).
- Cap rate 20.6% vs local median 8.1% in Salem — top-decile yield for the area; either an underpriced asset or a hidden risk that comps aren't pricing in. Stress-test before assuming the spread holds.
Location & tenants
- Location reads 61/100 on livability (#462 in NJ) — a middle-class / working-renter tenant base. Strengths: cost of living A+, health & safety A+, crime B; Watch: amenities F, commute F, employment F.
- Salem City School District (town): math 6% / reading 24% proficiency, ranked #464 of 472 in NJ (top 98%) — low school quality limits family demand, transient renter base, plan for 1-2y turnover; 85% free/reduced lunch — lower-income household profile, screen leases tightly.
- Zoned schools: John Fenwick Academy (411 students, 77% FRL); Salem Middle School (math 2% / reading 21%, grade F, #423 of 431 statewide, top 98%, 487 students, 79% FRL); Salem High School (math 17% / reading 37%, grade F, #312 of 399 statewide, top 79%, 420 students, 52% FRL) — zoned schools average 69% FRL vs 85% district-wide (15 pts lower); this property's tenant base skews higher-income than the district average.
- Market conditions: 103 active listings in the ZIP; 2 comparable units currently listed for rent nearby; 95 units permitted in Salem County in 2024 (0 in 5+ unit buildings).
- At $2,383/mo this rent would consume 52% of the median local household income ($55k/yr) (locally 663% of renters already pay >50% of income on rent) — very limited rent-growth headroom before tenants either downsize or default.
Forward outlook
- In year one you build about $311 of equity ($691 loan paydown + $-380 appreciation (-0.4% local appreciation)).
- Salem County population projected at -23% by 2050 — secular population decline; favor cash flow + early exit over multi-decade hold.
- At projected returns (-0.4% appreciation + 3.0% rent growth), your $28k cash investment doubles in ~2 years — after that, you're playing with house money.
Negotiation context
- Only 1 days on market — expect competitive offers; lowballing is unlikely to land.
- 5 sale attempts since 23y ago with the ask held roughly flat each time — persistent listings suggest the price (not the market) is what's stuck; bring a comps-based counter.
- Current owner paid $48k; list at $100k implies a 108% gain — meaningful room to come down on a strong offer.
Risks & watch-outs
- Watch-outs: built in 1925 — expect roof / HVAC / electrical / plumbing capex.
- Climate carrying-cost: moderate flood risk; major wind risk, 27% chance of damaging wind over 30y; extreme-heat days projected 7→15/yr by 2055 (HVAC capex compounding) — expect insurance premiums to compound above CPI over the hold.
Questions for the listing agent
- Built in 1925 — when were the roof, HVAC, electrical panel, plumbing, and water heater last replaced?
- Is there a deadline driving the sale (1031 exchange, divorce, estate, relocation)? That informs how much negotiation room exists.
- Schools are D-rated, which usually means shorter tenancies and higher turnover. Who's the typical renter profile here, and what's been the actual vacancy rate?
- What's the average days-on-market for RENTAL listings here right now (not sales)? A rising rental-DOM trend means longer vacancies and softer asking-rent achievability than the comps imply.
- What's the recent tenant-quality profile in this submarket — average credit score on applications, eviction rate, late-payment / NSF rate, and stable-employment percentage? A property-management company in the area should have these aggregated.
- How much new for-sale + rental construction is in the pipeline within 1–3 miles? Heavy new supply typically softens prices + rents 12–24 months out; constrained supply supports both.
Investment metrics
- 1% rule
- 2.38% ✓
- Cap rate
- 20.59%
- Cash-on-cash
- 51.08%
- DSCR
- 3.27
- GRM
- 3.5
CMA / ARV
- ARV (on-the-fly)
- $136,696
- Comps found
- 12
Show comp detail 12 sales within ~0.75 mi
| Address | Dist | Beds/Ba | Sqft | Sold | Price | $/sf | Match |
|---|---|---|---|---|---|---|---|
| 63 Seventh St | 0.00mi | 4/2.5 | 2,441 (0%) | 1mo | $104,000 | $43 | 100 |
| 61 Eighth St | 0.07mi | 4/2.5 | 2,344 (-4%) | 11mo | $230,000 | $98 | 81 |
| 49 Market St | 0.21mi | 5/2.5 (+1) | 2,459 (+1%) | 10mo | $247,000 | $100 | 75 |
| 154 Seventh St | 0.20mi | 4/2.0 | 2,692 (+10%) | 12mo | $45,000 | $17 | 61 |
| 234-236 Church St | 0.44mi | 5/2.0 (+1) | 2,394 (-2%) | 18mo | $50,000 | $21 | 55 |
| 35 Walnut St | 0.50mi | 4/1.5 | 2,278 (-7%) | 9mo | $180,000 | $79 | 54 |
| 349 E Broadway | 0.59mi | 5/2.0 (+1) | 2,348 (-4%) | 16mo | $65,000 | $28 | 46 |
| 19 Olive St | 0.60mi | 3/2.0 (-1) | 2,529 (+4%) | 16mo | $133,000 | $53 | 46 |
| 337 Craven Ave | 0.52mi | 5/2.0 (+1) | 2,205 (-10%) | 9mo | $306,000 | $139 | 45 |
| 56 New Market St | 0.53mi | 4/1.5 | 2,240 (-8%) | 16mo | $50,000 | $22 | 45 |
| 26 Olive St | 0.62mi | 4/1.0 | 2,164 (-11%) | 3mo | $200,000 | $92 | 44 |
| 201 Wesley St | 0.54mi | 3/1.0 (-1) | 2,175 (-11%) | 21mo | $122,000 | $56 | 28 |
Match score weights: distance 35% · size 25% · config 20% · recency 20%. Top-matched comps best support the ARV.
Projected returns pro-forma
-0.38% appreciation · 3.0% rent growth · sell at horizon
- IRR
- 52.1%
- Equity multiple
- 3.54×
- Total profit
- $71,242
- Equity at exit
- $27,150
- IRR
- 55.0%
- Equity multiple
- 7.11×
- Total profit
- $171,072
- Equity at exit
- $31,166
Cash invested: $28,000 (down + closing). Projections, not guarantees.
Landlord ↔ Tenant lean methodology
- Overall (STATE)
- 21 Tenant-Leaning
- State New Jersey
- 21 Tenant-Leaning · D+6
- County
- — inherits STATE
- City
- — inherits STATE
ZIP-level market 08079
- Home prices YoY
- -0.1%
- Active inventory
- 103
- Price-to-rent
- 3.5×
Monthly cashflow live
- Estimated rent
- $2,383 medium interval (Pro) →
- Mortgage (P&I)
- −$524
- Tax est. 1.5%
- −$125 /mo · $1,500/yr
- Insurance
- −$42
- HOA
- −$0
- Lot rent
- −$0
- Vacancy / Maint / Mgmt
- −$501
- Net cashflow
- $1,192
Break-even live
Sensitivity live
| Price | -10% $1,261 | -5% $1,226 | +0% $1,192 | +5% $1,157 | +10% $1,123 |
|---|---|---|---|---|---|
| Rent | -10% $1,003 | -5% $1,098 | +0% $1,192 | +5% $1,286 | +10% $1,380 |
| Rate | -1.0pp $1,242 | -0.5pp $1,217 | base $1,192 | +0.5pp $1,166 | +1.0pp $1,140 |
UW: 25.0% down · 7.5% · 30yr · 1.5% tax · 5.0% vac · 8.0% maint · 8.0% mgmt
Financing live
Cash to close
- Down payment
- $25,000
- Closing costs
- $3,000
- Reserves months
- —
- Total cash needed
- —
Loan-product check · same deal, 3 products live
Conventional
25% down · 7.5% · 30yr
- Down + closing
- —
- Monthly P&I
- —
- Monthly cashflow
- —
- DSCR
- —
- Eligible?
- —
Personal DTI + credit; lowest rate.
DSCR
20% down · 8.5% · 30yr
- Down + closing
- —
- Monthly P&I
- —
- Monthly cashflow
- —
- DSCR
- —
- Eligible?
- —
No personal income docs; deal must DSCR.
Hard money
10% down · 12.0% · 12mo
- Down + closing
- —
- Monthly P&I
- —
- Monthly cashflow
- —
- DSCR
- —
- Eligible?
- —
Short-term bridge; refi at stabilization.
Rent comps 2 comps
| Address | Beds | Baths | Sqft | Rent | $/sqft | DOM | Units | Dist |
|---|---|---|---|---|---|---|---|---|
| 270-272 Grant St Salem, NJ | 4.0 | 1.0 | 1644 | $2,100 | $1.28 | 7d | 1 | 0.17mi |
| 332 E Broadway Salem, NJ | 3.0 | 2.0 | 1844 | $1,980 | $1.07 | 46d | 1 | 0.55mi |
Listing history 12 events
-
2026-05-03status Pending
-
2026-05-02$100,000 Active
-
2008-09-26soldstatus $48,000 157-char remark
Show marketing remark (157 chars)
BANK OWNED PROPERTY! ALL OFFERS MUST HAVE PREQUAL & PROOF OF FUNDS! PROPERTY SOLD AS IS! ALL CERTS AND REPAIRS AND THE RESPONSIBILITY OF THE BUYER!!
-
2008-08-24historical 157-char remark
Show marketing remark (157 chars)
BANK OWNED PROPERTY! ALL OFFERS MUST HAVE PREQUAL & PROOF OF FUNDS! PROPERTY SOLD AS IS! ALL CERTS AND REPAIRS AND THE RESPONSIBILITY OF THE BUYER!!
-
2008-08-08$56,500 157-char remark
Show marketing remark (157 chars)
BANK OWNED PROPERTY! ALL OFFERS MUST HAVE PREQUAL & PROOF OF FUNDS! PROPERTY SOLD AS IS! ALL CERTS AND REPAIRS AND THE RESPONSIBILITY OF THE BUYER!!
-
2007-10-17historical
-
2007-09-21$129,900
-
2007-01-27historical
-
2006-08-13$112,500
-
2004-07-28soldstatus $65,000
-
2004-05-24historical
-
2003-06-13$65,000
ⓘ Source: listings_history table (triggers on properties + properties_extension) + one-shot
backfill from property_details.listing_events for pre-trigger history.
Climate risk First Street
- Flood 5/10 Major FEMA zone X (unshaded) · 22% chance over 30 yrs
- Wildfire 1/10 Low
- Heat 7/10 Severe 7 d/yr ≥103°F today · 15 d/yr by 30 yrs out
- Wind 6/10 Major 27% chance of damaging wind over 30 yrs
- Air quality 3/10 Moderate 2 unhealthy d/yr today · 4 by 30 yrs out
Nearby sold comps map
Loading sold comps map…
Walkable amenities ~0.75 mi
Loading nearby amenities…
Taxation est. · year 1
- Rental income
- $28,600
- − Mortgage interest
- −$5,602
- − Property taxes
- −$1,500
- − Insurance
- −$500
- − Repairs & maintenance
- −$2,288
- − Management
- −$2,288
- − Depreciation
- −$2,909
- Taxable income
- $13,514
- Est. tax owed @ 24.0%
- −$3,243
- After-tax cash flow
- $11,058/yr
For passive investors: Depreciation is non-cash, so a rental often shows a tax loss while cash-flowing — sheltering income. Rental losses are passive: they offset passive income freely, and up to $25,000/yr can offset ordinary (W-2) income if you actively participate and your MAGI is under $100k (phasing out to $0 by $150k); unused losses carry forward. On sale, claimed depreciation is recaptured at up to 25%, and gains may owe capital-gains tax (a 1031 exchange can defer both). Figures are a year-1 estimate at your 24.0% rate — not tax advice; consult a CPA.
Schools (NCES district)
- District
- Salem City School District
- NCES district ID
- 3414550
- Math proficiency
- 6% ▼ -1.00%
- Reading proficiency
- 24% ▲ 2.00%
- Median HH income
- $27,118
- Composite
- 11.51/100
- National rank
- #9702
- State rank
- #464 of 472 in NJ
Livability — Salem
- Score
- 61/100
- State rank
- #462
- US rank
- #17533
Category grades
Schools grade is shown separately in the Schools card above.
Census & demographics
- Census place
- Salem, NJ
- County
- Salem County · 24,175 people
- City population
- 10,762
- Metro
- Philadelphia-Camden-Wilmington, PA-NJ-DE-MD
- Population (ZIP)
- 10,762
- Household income
- $54,641
- Rent vs Own
- Severe rent burden
- 663.0
Population outlook (Salem County) Hauer SSP2
- Today (2025)
- 59,905 people
- By 2030
- 57,351 · -4.3%
- By 2040
- 51,837 · -13.5%
- By 2050
- 46,356 · -22.6%
- By 2075
- 36,452 · -39.2%
- By 2100
- 28,907 · -51.7%
Race, ethnicity, and origin ACS 2023
- Neighborhood character
- Diverse neighborhood (Simpson 0.55)
- Race & ethnicity
- White 59% Black 31% Hispanic / Latino 6% Two or more races 5% Asian 1%
- Hispanic origin (detail)
- Puerto Rican 5%
- Common ancestry
- Romanian 3% Lithuanian 2% Italian 1%
- Foreign-born
- 2% · Canada
- Languages at home
- 94% English-only · Spanish 4% Tagalog/Filipino 1%
Political lean MEDSL · Salem
- 2024 margin
- R (+19.2) · D 39.6% · R 58.8% · Other 1.6%
- 2008→2024 swing
- -23.1pp toward R · 2008: 3.9pp · 2024: -19.2pp
- All cycles
- 2024: R+19.2 2020: R+12.8 2016: R+15.4 2012: D+0.8 2008: D+3.9
Not yet ingested
- Civics
- —
Market trends
- HPI YoY
- ▼ -0.38%
- Current HPI
- 258.0047
- Rent YoY
- —
- Metro
- Philadelphia-Camden-Wilmington, PA-NJ-DE-MD
- State GDP YoY
- ▲ 2.05%
- F500 in state
- 34
Industry mix (Fortune 500 HQ in NJ)
| Industry | F500 HQs | Revenue |
|---|---|---|
| Consumer Goods | 3 | $31B |
|
||
| Pharmaceuticals | 2 | $153B |
|
||
| Technology | 2 | $21B |
|
||
| Insurance | 2 | $20B |
|
||
| Healthcare | 2 | $19B |
|
||
| Financial Services | 1 | $70B |
|
||
Price history
+53.8% since first listed12 events — show timeline
- 2026-05-03 Pending — BRIGHT MLS
- 2026-05-02 Listed $100,000 BRIGHT MLS
- 2008-09-26 Sold (MLS) $48,000 SJSRMLS
- 2008-08-24 Listing Removed — SJSRMLS
- 2008-08-08 Listed $56,500 SJSRMLS
- 2007-10-17 Listing Removed — BRIGHT MLS
- 2007-09-21 Listed $129,900 BRIGHT MLS
- 2007-01-27 Listing Removed — BRIGHT MLS
- 2006-08-13 Listed $112,500 BRIGHT MLS
- 2004-07-28 Sold (MLS) $65,000 BRIGHT MLS
- 2004-05-24 Listing Removed — BRIGHT MLS
- 2003-06-13 Listed $65,000 BRIGHT MLS
Cash-flow waterfall
monthlySold comps — $/sqft
last 12 mo · ≤1 miLoading sold comps…