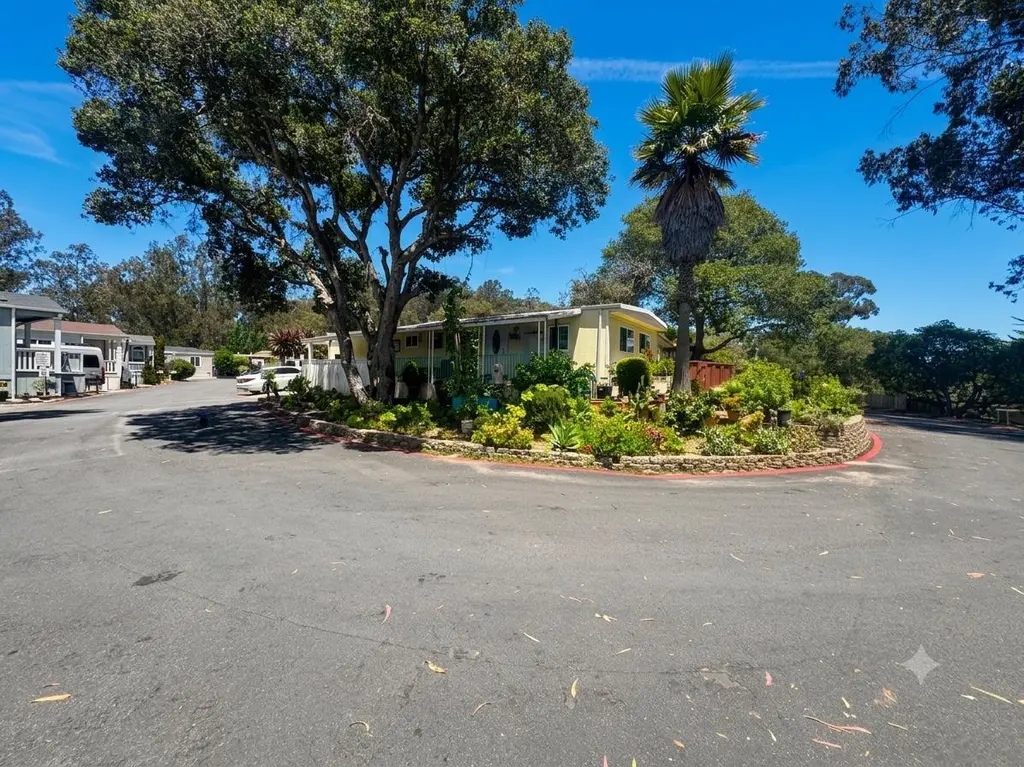
17779 Vierra Canyon Rd #13
Prunedale, CA 93907
$265,000D+
2 bd · 2.0 ba ·
1,000 sqft ·
Built 1965
· Manufactured
· Active
· 10 DOM
Cashflow @ list (25.0% down · 7.5%)
Estimated rent
$2,782/mo
Mortgage (P&I)
−$1,390
Tax + insurance
−$442
HOA
−$0
Vac / Maint / Mgmt
−$584
Net cashflow
$366/mo
Annual
$4,393/yr
Cap rate
7.95%
Cash-on-cash
5.92%
DSCR
1.26
1% rule
1.05%
Cash to close
$74,200
Investor read
- This is a 2-bed/2.0-bath manufactured listed at $265k.
- At list price, monthly cash flow is $366 ($4k/yr) — positive.
- The deal already cash-flows at list — no discount required.
- Meets the 1% rule at list price ($3k rent vs $265k).
- Only 10 days on market — expect competitive offers; lowballing is unlikely to land.
- Local home prices are declining (-3.0%/yr); year-one equity from $2k of loan paydown is wiped out by about $8k of value loss. Plan a longer hold.
- Location reads 56/100 on livability (#780 in CA) — a working-class tenant base; expect higher turnover. Strengths: employment A+, housing B+; Watch: crime C-, amenities F, commute F.
- North Monterey County Unified (suburban): math 20% / reading 34% proficiency, ranked #1,055 of 1,400 in CA (top 75%) — low school quality limits family demand, transient renter base, plan for 1-2y turnover; 66% free/reduced lunch — lower-income household profile, screen leases tightly.
- Market conditions: 49 active listings in the ZIP; 1 comparable units currently listed for rent nearby; solid renter incomes; 530 units permitted in Monterey County in 2024 (50 in 5+ unit buildings).
- Monterey County population projected at +10% by 2050 — modest demand growth; plan on rents tracking national, not racing it.
- 5 sale attempts since 21y ago with the ask held roughly flat each time — persistent listings suggest the price (not the market) is what's stuck; bring a comps-based counter.
- Current owner paid $58k; list at $265k implies a 361% gain — meaningful room to come down on a strong offer.
- Climate carrying-cost: moderate wildfire risk — expect insurance premiums to compound above CPI over the hold.
- Cap rate 8.0% vs local median 2.3% in Prunedale — top-decile yield for the area; either an underpriced asset or a hidden risk that comps aren't pricing in. Stress-test before assuming the spread holds.
- This rent runs 32% of the median local income ($105k/yr) — at the standard rent-burdened threshold; future hikes will face affordability resistance.
Questions for listing agent
- Built in 1965 — when were the roof, HVAC, electrical panel, plumbing, and water heater last replaced?
- Is there a deadline driving the sale (1031 exchange, divorce, estate, relocation)? That informs how much negotiation room exists.
- The area grade is low — what's the realistic commute time and amenity access for the typical tenant pool here? Any planned neighborhood developments (good or bad) we should know about?
- What's the average days-on-market for RENTAL listings here right now (not sales)? A rising rental-DOM trend means longer vacancies and softer asking-rent achievability than the comps imply.
- What's the recent tenant-quality profile in this submarket — average credit score on applications, eviction rate, late-payment / NSF rate, and stable-employment percentage? A property-management company in the area should have these aggregated.
- How much new for-sale + rental construction is in the pipeline within 1–3 miles? Heavy new supply typically softens prices + rents 12–24 months out; constrained supply supports both.
CashFlowRE · CFR-B737GR556W2Y4E
· Data 3 days ago
cashflowre.app · 2026-05-29