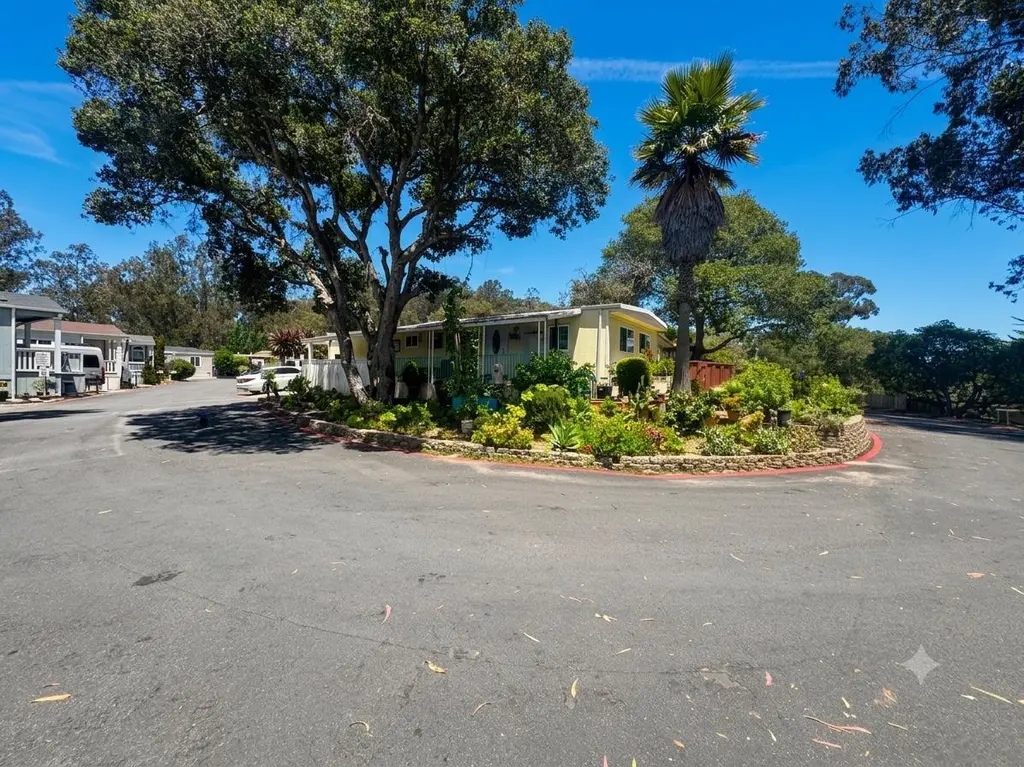
17779 Vierra Canyon Rd #13 · Prunedale, CA
Flood risk 1/10 · Minimal
- FEMA flood zone
- X (unshaded)
- Chance of flooding over 30 yrs
- 0.0%
- Est. flood insurance / yr
- $507 – $1,088
Fire risk 5/10 · Moderate
- Est. fire insurance / yr
- $659 – $1,223
Heat risk 3/10 · Minor
- Hot days now (above 84°F)
- 7 days/yr
- Hot days in 30 yrs
- 15 days/yr
Wind risk 1/10 · Minimal
- Chance of severe wind over 30 yrs
- —
Air-quality risk 6/10 · Moderate
- Unhealthy air days now
- 11 days/yr
- Unhealthy air days in 30 yrs
- 11 days/yr
Risk factors via First Street. Map © Google.
Why this score? — see what drove the D+ grade
The composite is a weighted blend of 9 inputs, each scored 0–100. Each bar is that input's sub-score; the figure is the points it added to the 100-point composite (weight × sub-score).
- Cash flow +20.8/30.0
- DSCR +6.6/10.0
- 1% rule +5.5/10.0
- Schools +2.8/10.0
- Livability +2.8/5.0
- Rent growth +2.5/5.0
- Condition / age +2.5/5.0
- ARV discount +1.8/15.0
- Appreciation +0.0/10.0
$265,000
🖨 Deal sheet (PDF) 📄 Offer letter ✓ Due diligence
Listing remarks MLS
Nestled on a charming, beautifully landscaped corner lot with a vibrant succulent garden, this inviting mobile home blends comfort, functionality, and classic appeal. Step inside to find a spacious, bright kitchen equipped with warm cabinetry, expansive countertops, a gas range, and a generous dining area perfect for family meals. The thoughtful layout features two cozy bedrooms with laminate flooring and two well-appointed bathrooms including one with a modern, glass-enclosed corner shower. Enjoy a massive, covered front porch that spans the length of the home, alongside a private, covered back patio area ideal for barbecuing and outdoor dining. Includes a dedicated laundry room offering extra storage and a covered carport.
Key facts
- Built 1965
- Listed 10 days
Property features AI
Finance
- Other: Located in a park with leased land
Exterior
- Parking: Assigned space number 13 (space rent $1,000)
- Utilities: Public water; Public sewer; Public utilities
- Home design: Manufactured home on leased land
- Exterior features: Composition roof; Lot size source: Assessor
Interior
- Kitchen: Eat-in kitchen (appliances not listed)
- Bedrooms: 2 bedrooms
- Bathrooms: 2 full bathrooms
- Heating & cooling: Central forced air heating; Ceiling fan(s)
- Interior features: Kitchen and family room combined; Eat-in kitchen; Ceiling fan(s); Central forced air heating
Neighborhood map
What this means for you Summary
Snapshot
- This is a 2-bed/2.0-bath manufactured listed at $265k.
Deal economics
- At list price, monthly cash flow is $366 ($4k/yr) — positive.
- The deal already cash-flows at list — no discount required.
- Meets the 1% rule at list price ($3k rent vs $265k).
- Cap rate 8.0% vs local median 2.3% in Prunedale — top-decile yield for the area; either an underpriced asset or a hidden risk that comps aren't pricing in. Stress-test before assuming the spread holds.
Location & tenants
- Location reads 56/100 on livability (#780 in CA) — a working-class tenant base; expect higher turnover. Strengths: employment A+, housing B+; Watch: crime C-, amenities F, commute F.
- North Monterey County Unified (suburban): math 20% / reading 34% proficiency, ranked #1,055 of 1,400 in CA (top 75%) — low school quality limits family demand, transient renter base, plan for 1-2y turnover; 66% free/reduced lunch — lower-income household profile, screen leases tightly.
- Market conditions: 49 active listings in the ZIP; 1 comparable units currently listed for rent nearby; solid renter incomes; 530 units permitted in Monterey County in 2024 (50 in 5+ unit buildings).
- This rent runs 32% of the median local income ($105k/yr) — at the standard rent-burdened threshold; future hikes will face affordability resistance.
Forward outlook
- Local home prices are declining (-3.0%/yr); year-one equity from $2k of loan paydown is wiped out by about $8k of value loss. Plan a longer hold.
- Monterey County population projected at +10% by 2050 — modest demand growth; plan on rents tracking national, not racing it.
Negotiation context
- Only 10 days on market — expect competitive offers; lowballing is unlikely to land.
- 5 sale attempts since 21y ago with the ask held roughly flat each time — persistent listings suggest the price (not the market) is what's stuck; bring a comps-based counter.
- Current owner paid $58k; list at $265k implies a 361% gain — meaningful room to come down on a strong offer.
Risks & watch-outs
- Climate carrying-cost: moderate wildfire risk — expect insurance premiums to compound above CPI over the hold.
Questions for the listing agent
- Built in 1965 — when were the roof, HVAC, electrical panel, plumbing, and water heater last replaced?
- Is there a deadline driving the sale (1031 exchange, divorce, estate, relocation)? That informs how much negotiation room exists.
- The area grade is low — what's the realistic commute time and amenity access for the typical tenant pool here? Any planned neighborhood developments (good or bad) we should know about?
- What's the average days-on-market for RENTAL listings here right now (not sales)? A rising rental-DOM trend means longer vacancies and softer asking-rent achievability than the comps imply.
- What's the recent tenant-quality profile in this submarket — average credit score on applications, eviction rate, late-payment / NSF rate, and stable-employment percentage? A property-management company in the area should have these aggregated.
- How much new for-sale + rental construction is in the pipeline within 1–3 miles? Heavy new supply typically softens prices + rents 12–24 months out; constrained supply supports both.
Investment metrics
- 1% rule
- 1.05% ✓
- Cap rate
- 7.95%
- Cash-on-cash
- 5.92%
- DSCR
- 1.26
- GRM
- 7.9
CMA / ARV
- ARV (on-the-fly)
- $235,000
- Comps found
- 1
Show comp detail 1 sale within ~0.75 mi
| Address | Dist | Beds/Ba | Sqft | Sold | Price | $/sf | Match |
|---|---|---|---|---|---|---|---|
| 17779 Vierra Canyon Rd #19 | 0.06mi | 3/2.0 (+1) | 1,100 (+10%) | 13mo | $259,000 | $235 | 65 |
Match score weights: distance 35% · size 25% · config 20% · recency 20%. Top-matched comps best support the ARV.
Projected returns pro-forma
-3.0% appreciation · 3.0% rent growth · sell at horizon
- IRR
- -7.1%
- Equity multiple
- 0.74×
- Total profit
- $-19,585
- Equity at exit
- $39,512
- IRR
- 2.5%
- Equity multiple
- 1.18×
- Total profit
- $13,138
- Equity at exit
- $22,912
Cash invested: $74,200 (down + closing). Projections, not guarantees.
Landlord ↔ Tenant lean methodology
- Overall (STATE)
- 18 Strongly Tenant-Friendly
- State California
- 18 Strongly Tenant-Friendly · D+13
- County
- — inherits STATE
- City
- — inherits STATE
ZIP-level market 93907
- Active inventory
- 49
- Price-to-rent
- 7.9×
Monthly cashflow live
- Estimated rent
- $2,782 medium interval (Pro) →
- Mortgage (P&I)
- −$1,390
- Tax est. 1.5%
- −$331 /mo · $3,975/yr
- Insurance
- −$110
- HOA
- −$0
- Vacancy / Maint / Mgmt
- −$584
- Net cashflow
- $366
Break-even live
Sensitivity live
| Price | -10% $549 | -5% $458 | +0% $366 | +5% $274 | +10% $183 |
|---|---|---|---|---|---|
| Rent | -10% $146 | -5% $256 | +0% $366 | +5% $476 | +10% $586 |
| Rate | -1.0pp $500 | -0.5pp $433 | base $366 | +0.5pp $297 | +1.0pp $228 |
UW: 25.0% down · 7.5% · 30yr · 1.5% tax · 5.0% vac · 8.0% maint · 8.0% mgmt
Financing live
Cash to close
- Down payment
- $66,250
- Closing costs
- $7,950
- Reserves months
- —
- Total cash needed
- —
Loan-product check · same deal, 3 products live
Conventional
25% down · 7.5% · 30yr
- Down + closing
- —
- Monthly P&I
- —
- Monthly cashflow
- —
- DSCR
- —
- Eligible?
- —
Personal DTI + credit; lowest rate.
DSCR
20% down · 8.5% · 30yr
- Down + closing
- —
- Monthly P&I
- —
- Monthly cashflow
- —
- DSCR
- —
- Eligible?
- —
No personal income docs; deal must DSCR.
Hard money
10% down · 12.0% · 12mo
- Down + closing
- —
- Monthly P&I
- —
- Monthly cashflow
- —
- DSCR
- —
- Eligible?
- —
Short-term bridge; refi at stabilization.
Rent comps 1 comps
| Address | Beds | Baths | Sqft | Rent | $/sqft | DOM | Units | Dist |
|---|---|---|---|---|---|---|---|---|
| 1018 El Camino Real Unit 1 Prunedale, CA | 3.0 | 2.0 | 1160 | $3,200 | $2.76 | 13d | 1 | 0.57mi |
Listing history 8 events
-
2026-06-18days on market $265,000 Active 10 DOM
-
2026-06-17days on market $265,000 Active 9 DOM
-
2026-06-16days on market $265,000 Active 8 DOM
-
2026-06-15days on market $265,000 Active 7 DOM
-
2026-06-14days on market $265,000 Active 5 DOM
-
2026-06-13days on market $265,000 Active 4 DOM
-
2026-06-10days on market $265,000 Active 2 DOM
-
2026-06-09$265,000 Active 1 DOM
ⓘ Source: listings_history table (triggers on properties + properties_extension) + one-shot
backfill from property_details.listing_events for pre-trigger history.
Climate risk First Street
- Flood 1/10 Low FEMA zone X (unshaded) · 0% chance over 30 yrs
- Wildfire 5/10 Major
- Heat 3/10 Moderate 7 d/yr ≥84°F today · 15 d/yr by 30 yrs out
- Wind 1/10 Low
- Air quality 6/10 Major 11 unhealthy d/yr today · 11 by 30 yrs out
Nearby sold comps map
Loading sold comps map…
Walkable amenities ~0.75 mi
Loading nearby amenities…
Taxation est. · year 1
- Rental income
- $33,378
- − Mortgage interest
- −$14,844
- − Property taxes
- −$3,975
- − Insurance
- −$1,325
- − Repairs & maintenance
- −$2,670
- − Management
- −$2,670
- − Depreciation
- −$7,709
- Taxable income
- $185
- Est. tax owed @ 24.0%
- −$44
- After-tax cash flow
- $4,348/yr
For passive investors: Depreciation is non-cash, so a rental often shows a tax loss while cash-flowing — sheltering income. Rental losses are passive: they offset passive income freely, and up to $25,000/yr can offset ordinary (W-2) income if you actively participate and your MAGI is under $100k (phasing out to $0 by $150k); unused losses carry forward. On sale, claimed depreciation is recaptured at up to 25%, and gains may owe capital-gains tax (a 1031 exchange can defer both). Figures are a year-1 estimate at your 24.0% rate — not tax advice; consult a CPA.
Schools (NCES district)
- District
- North Monterey County Unified
- NCES district ID
- 0627590
- Math proficiency
- 20% ▲ 1.00%
- Reading proficiency
- 34% ▲ 4.00%
- Median HH income
- $66,789
- Composite
- 28.25/100
- National rank
- #12165
- State rank
- #1055 of 1400 in CA
Livability — Prunedale
- Score
- 56/100
- State rank
- #780
- US rank
- #22467
Category grades
Schools grade is shown separately in the Schools card above.
Census & demographics
- Census place
- Prunedale, CA
- County
- Monterey County · 241,191 people
- City population
- 24,922
- Metro
- Salinas, CA
- Population (ZIP)
- 25,146
- Household income
- $104,942
- Rent vs Own
- Severe rent burden
- 590.0
Population outlook (Monterey County) Hauer SSP2
- Today (2025)
- 458,436 people
- By 2030
- 469,418 · +2.4%
- By 2040
- 489,615 · +6.8%
- By 2050
- 506,696 · +10.5%
- By 2075
- 531,048 · +15.8%
- By 2100
- 519,153 · +13.2%
Race, ethnicity, and origin ACS 2023
- Neighborhood character
- Diverse neighborhood (Simpson 0.58)
- Race & ethnicity
- Hispanic / Latino 58% White 28% Two or more races 15% Asian 8% Black 1%
- Hispanic origin (detail)
- Mexican 53% Puerto Rican 1%
- Common ancestry
- Lithuanian 2% Russian 2% Slovak 1%
- Foreign-born
- 26% · Canada, Vietnam, China
- Languages at home
- 48% English-only · Spanish 45% Tagalog/Filipino 2% Other Asian/Pacific 2%
Political lean MEDSL · Monterey
- 2024 margin
- Strong D (+29.9) · D 63.4% · R 33.5% · Other 3.0%
- 2008→2024 swing
- -8.4pp toward R · 2008: 38.3pp · 2024: 29.9pp
- All cycles
- 2024: D+29.9 2020: D+41.3 2016: D+39.7 2012: D+33.9 2008: D+38.3
Not yet ingested
- Civics
- —
Market trends
- HPI YoY
- ▼ -492.44%
- Current HPI
- 290.6503
- Rent YoY
- —
- Metro
- Salinas, CA
- State GDP YoY
- ▲ 3.21%
- F500 in state
- 116
Industry mix (Fortune 500 HQ in CA)
| Industry | F500 HQs | Revenue |
|---|---|---|
| Technology | 27 | $1,492B |
|
||
| Financial Services | 3 | $174B |
|
||
| Retail | 3 | $44B |
|
||
| Insurance | 3 | $26B |
|
||
| Media / Entertainment | 2 | $115B |
|
||
| Pharmaceuticals / Biotech | 2 | $62B |
|
||
Price history
+278.6% since first listed11 events — show timeline
- 2026-06-08 Listed $265,000 MLSListings
- 2026-06-08 Listed $265,000 bridgeMLS, Bay East AOR, or Contra Costa AOR
- 2014-02-12 Sold (MLS) $57,500 MLSListings
- 2013-12-13 Pending — MLSListings
- 2013-11-07 Listed $65,500 MLSListings
- 2010-07-09 Sold (MLS) $35,000 MLSListings
- 2010-06-29 Listed $35,000 MLSListings
- 2010-06-29 Listing Removed — MLSListings
- 2006-03-07 Sold (MLS) $69,000 MLSListings
- 2006-01-14 Listing Removed — MLSListings
- 2005-08-26 Listed $70,000 MLSListings
Cash-flow waterfall
monthlySold comps — $/sqft
last 12 mo · ≤1 miLoading sold comps…