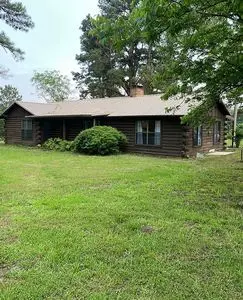
12708 FM 114
Avery, TX 75554
$150,000D
2 bd · 2.0 ba ·
1,396 sqft ·
Built 1977
· SingleFamily
· Active
· 15 DOM
Cashflow @ list (25.0% down · 7.5%)
Estimated rent
$1,095/mo
Mortgage (P&I)
−$787
Tax + insurance
−$259
HOA
−$0
Vac / Maint / Mgmt
−$230
Net cashflow
$-180/mo
Annual
$-2,163/yr
Cap rate
4.85%
Cash-on-cash
-5.15%
DSCR
0.77
1% rule
0.73%
Cash to close
$42,000
Investor read
- This is a 2-bed/2.0-bath single-family listed at $150k.
- At list price, monthly cash flow is $-180 ($-2k/yr) — negative.
- To cash-flow at today's rent, offer at most $118k (21.2% below list).
- To meet the 1% rule (rent ≥ 1% of price), the offer needs to be $110k (27.0% below list).
- It's been on market 15 days — a 2% lower offer ($148k) is reasonable based on typical stale-listing flexibility.
- Recommended offer: $110k (27.0% below list) — sets the bar for 1% rule.
- In year one you build about $16k of equity ($1k loan paydown + $15k appreciation (10.0% local appreciation)).
- Location reads 64/100 on livability (#807 in TX) — a middle-class / working-renter tenant base. Strengths: cost of living A+, housing A+; Watch: employment D+, crime F, amenities F.
- Avery ISD (rural): math 55% / reading 50% proficiency, ranked #306 of 1,141 in TX (top 27%) — acceptable for families but not a draw, mixed tenant base, ~2y average lease.
- Zoned schools: Avery El (math 57% / reading 52%, grade C, #621 of 4,322 statewide, top 15%, 152 students, 70% FRL); Avery Secondary (math 62% / reading 57%, grade C+, #275 of 1,632 statewide, top 19%, 183 students, 58% FRL) — zoned schools average 64% FRL vs 48% district-wide (16 pts higher); higher-poverty schools than district average — tighter screening recommended.
- Market conditions: 20 active listings in the ZIP; 14 units permitted in Red River County in 2024 (0 in 5+ unit buildings).
- Red River County population projected at -25% by 2050 — secular population decline; favor cash flow + early exit over multi-decade hold.
- By year 3, paydown + projected appreciation supports a ~$41k cash-out refi (75% LTV) — recoverable capital for the next deal without selling this one.
- Climate carrying-cost: moderate wildfire risk; extreme-heat days projected 7→23/yr by 2055 (HVAC capex compounding) — expect insurance premiums to compound above CPI over the hold.
Questions for listing agent
- What do current leases actually rent for vs. the listed asking? Can we see a recent rent roll and the last 12 months of T-12 income?
- Built in 1977 — when were the roof, HVAC, electrical panel, plumbing, and water heater last replaced?
- Is there a deadline driving the sale (1031 exchange, divorce, estate, relocation)? That informs how much negotiation room exists.
- Crime grade is F in this area — have there been break-ins, vandalism, or insurance claims at this property in the last 3 years? What carrier currently insures it and at what premium?
- The area grade is low — what's the realistic commute time and amenity access for the typical tenant pool here? Any planned neighborhood developments (good or bad) we should know about?
- What's the average days-on-market for RENTAL listings here right now (not sales)? A rising rental-DOM trend means longer vacancies and softer asking-rent achievability than the comps imply.
- What's the recent tenant-quality profile in this submarket — average credit score on applications, eviction rate, late-payment / NSF rate, and stable-employment percentage? A property-management company in the area should have these aggregated.
- How much new for-sale + rental construction is in the pipeline within 1–3 miles? Heavy new supply typically softens prices + rents 12–24 months out; constrained supply supports both.
CashFlowRE · CFR-B7HBXG9M17FDRE
· Data 3 weeks ago
cashflowre.app · 2026-05-29