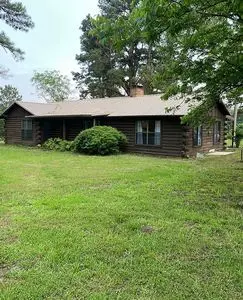
12708 FM 114 · Avery, TX
Flood risk 1/10 · Minimal
- FEMA flood zone
- —
- Chance of flooding over 30 yrs
- 0.0%
- Est. flood insurance / yr
- —
Fire risk 5/10 · Moderate
- Est. fire insurance / yr
- $1,222 – $2,270
Heat risk 7/10 · Major
- Hot days now (above 111°F)
- 7 days/yr
- Hot days in 30 yrs
- 23 days/yr
Wind risk 4/10 · Minor
- Chance of severe wind over 30 yrs
- 21.0%
Air-quality risk 1/10 · Minimal
- Unhealthy air days now
- 0 days/yr
- Unhealthy air days in 30 yrs
- 0 days/yr
Risk factors via First Street. Map © Google.
Why this score? — see what drove the D grade
The composite is a weighted blend of 9 inputs, each scored 0–100. Each bar is that input's sub-score; the figure is the points it added to the 100-point composite (weight × sub-score).
- Appreciation +10.0/10.0
- Cash flow +7.6/30.0
- ARV discount +7.5/15.0
- Schools +4.6/10.0
- Livability +3.2/5.0
- Rent growth +2.5/5.0
- Condition / age +2.5/5.0
- 1% rule +2.3/10.0
- DSCR +1.7/10.0
$150,000
🖨 Deal sheet (PDF) 📄 Offer letter ✓ Due diligence
Listing remarks
Cozy lil log home has had updates new counter tops & amp; sinks in kitchen & amp; bathrooms , new toilets , new carpet in bedrooms . Fairly new metal roof. its a little fixer upper Fully fenced pipe yard . Bar wire on outer perimeter fence with pond in pasture for watering animals mature pines big beautiful yard . Has a shed with awning & amp; power & amp; a carport .
Key facts
- New counter tops
- New toilets
- Metal roof
Tags
Neighborhood map
What this means for you Summary
Snapshot
- This is a 2-bed/2.0-bath single-family listed at $150k.
Deal economics
- At list price, monthly cash flow is $-180 ($-2k/yr) — negative.
- To cash-flow at today's rent, offer at most $118k (21.2% below list).
- To meet the 1% rule (rent ≥ 1% of price), the offer needs to be $110k (27.0% below list).
- Recommended offer: $110k (27.0% below list) — sets the bar for 1% rule.
Location & tenants
- Location reads 64/100 on livability (#807 in TX) — a middle-class / working-renter tenant base. Strengths: cost of living A+, housing A+; Watch: employment D+, crime F, amenities F.
- Avery ISD (rural): math 55% / reading 50% proficiency, ranked #306 of 1,141 in TX (top 27%) — acceptable for families but not a draw, mixed tenant base, ~2y average lease.
- Zoned schools: Avery El (math 57% / reading 52%, grade C, #621 of 4,322 statewide, top 15%, 152 students, 70% FRL); Avery Secondary (math 62% / reading 57%, grade C+, #275 of 1,632 statewide, top 19%, 183 students, 58% FRL) — zoned schools average 64% FRL vs 48% district-wide (16 pts higher); higher-poverty schools than district average — tighter screening recommended.
- Market conditions: 20 active listings in the ZIP; 14 units permitted in Red River County in 2024 (0 in 5+ unit buildings).
Forward outlook
- In year one you build about $16k of equity ($1k loan paydown + $15k appreciation (10.0% local appreciation)).
- Red River County population projected at -25% by 2050 — secular population decline; favor cash flow + early exit over multi-decade hold.
- By year 3, paydown + projected appreciation supports a ~$41k cash-out refi (75% LTV) — recoverable capital for the next deal without selling this one.
Negotiation context
- It's been on market 15 days — a 2% lower offer ($148k) is reasonable based on typical stale-listing flexibility.
Risks & watch-outs
- Climate carrying-cost: moderate wildfire risk; extreme-heat days projected 7→23/yr by 2055 (HVAC capex compounding) — expect insurance premiums to compound above CPI over the hold.
Questions for the listing agent
- What do current leases actually rent for vs. the listed asking? Can we see a recent rent roll and the last 12 months of T-12 income?
- Built in 1977 — when were the roof, HVAC, electrical panel, plumbing, and water heater last replaced?
- Is there a deadline driving the sale (1031 exchange, divorce, estate, relocation)? That informs how much negotiation room exists.
- Crime grade is F in this area — have there been break-ins, vandalism, or insurance claims at this property in the last 3 years? What carrier currently insures it and at what premium?
- The area grade is low — what's the realistic commute time and amenity access for the typical tenant pool here? Any planned neighborhood developments (good or bad) we should know about?
- What's the average days-on-market for RENTAL listings here right now (not sales)? A rising rental-DOM trend means longer vacancies and softer asking-rent achievability than the comps imply.
- What's the recent tenant-quality profile in this submarket — average credit score on applications, eviction rate, late-payment / NSF rate, and stable-employment percentage? A property-management company in the area should have these aggregated.
- How much new for-sale + rental construction is in the pipeline within 1–3 miles? Heavy new supply typically softens prices + rents 12–24 months out; constrained supply supports both.
Investment metrics
- 1% rule
- 0.73% ✗
- Cap rate
- 4.85%
- Cash-on-cash
- -5.15%
- DSCR
- 0.77
- GRM
- 11.4
CMA / ARV
No comps found within radius.
Projected returns pro-forma
10.0% appreciation · 3.0% rent growth · sell at horizon
- IRR
- 20.6%
- Equity multiple
- 2.67×
- Total profit
- $70,236
- Equity at exit
- $135,132
- IRR
- 18.8%
- Equity multiple
- 6.14×
- Total profit
- $215,906
- Equity at exit
- $291,417
Cash invested: $42,000 (down + closing). Projections, not guarantees.
Landlord ↔ Tenant lean methodology
- Overall (STATE)
- 87 Strongly Landlord-Friendly
- State Texas
- 87 Strongly Landlord-Friendly · R+5
- County
- — inherits STATE
- City
- — inherits STATE
ZIP-level market 75554
- Home prices YoY
- 6.8%
- Active inventory
- 20
- Price-to-rent
- 11.4×
Monthly cashflow live
- Estimated rent
- $1,095 medium interval (Pro) →
- Mortgage (P&I)
- −$787
- Tax from tax record
- −$197 /mo · $2,358/yr
- Insurance
- −$62
- HOA
- −$0
- Vacancy / Maint / Mgmt
- −$230
- Net cashflow
- $-180
Break-even live
Sensitivity live
| Price | -10% $-95 | -5% $-138 | +0% $-180 | +5% $-223 | +10% $-265 |
|---|---|---|---|---|---|
| Rent | -10% $-267 | -5% $-224 | +0% $-180 | +5% $-137 | +10% $-94 |
| Rate | -1.0pp $-105 | -0.5pp $-142 | base $-180 | +0.5pp $-219 | +1.0pp $-259 |
UW: 25.0% down · 7.5% · 30yr · 1.5% tax · 5.0% vac · 8.0% maint · 8.0% mgmt
Financing live
Cash to close
- Down payment
- $37,500
- Closing costs
- $4,500
- Reserves months
- —
- Total cash needed
- —
Loan-product check · same deal, 3 products live
Conventional
25% down · 7.5% · 30yr
- Down + closing
- —
- Monthly P&I
- —
- Monthly cashflow
- —
- DSCR
- —
- Eligible?
- —
Personal DTI + credit; lowest rate.
DSCR
20% down · 8.5% · 30yr
- Down + closing
- —
- Monthly P&I
- —
- Monthly cashflow
- —
- DSCR
- —
- Eligible?
- —
No personal income docs; deal must DSCR.
Hard money
10% down · 12.0% · 12mo
- Down + closing
- —
- Monthly P&I
- —
- Monthly cashflow
- —
- DSCR
- —
- Eligible?
- —
Short-term bridge; refi at stabilization.
Listing history 2 events
-
2026-05-12$150,000 Active 374-char remark
-
1999-10-29soldstatus
ⓘ Source: listings_history table (triggers on properties + properties_extension) + one-shot
backfill from property_details.listing_events for pre-trigger history.
Tax reassessment forecast TX · Resets to sale price
- Current annual tax
- $2,358 · $197/mo
- Projected year-2 tax
- $2,745 · $229/mo
- Expected delta
- +$387/yr (+$32/mo · 16.4%)
ⓘ Screening estimate from a state-policy table — verify with the county assessor before closing.
Climate risk First Street
- Flood 1/10 Low 0% chance over 30 yrs
- Wildfire 5/10 Major
- Heat 7/10 Severe 7 d/yr ≥111°F today · 23 d/yr by 30 yrs out
- Wind 4/10 Moderate 21% chance of damaging wind over 30 yrs
- Air quality 1/10 Low 0 unhealthy d/yr today · 0 by 30 yrs out
Nearby sold comps map
Loading sold comps map…
Walkable amenities ~0.75 mi
Loading nearby amenities…
Taxation est. · year 1
- Rental income
- $13,146
- − Mortgage interest
- −$8,402
- − Property taxes
- −$2,358
- − Insurance
- −$750
- − Repairs & maintenance
- −$1,052
- − Management
- −$1,052
- − Depreciation
- −$4,364
- Taxable loss
- −$4,832
- Est. tax savings @ 24.0%
- +$1,160
- After-tax cash flow
- $-1,003/yr
For passive investors: Depreciation is non-cash, so a rental often shows a tax loss while cash-flowing — sheltering income. Rental losses are passive: they offset passive income freely, and up to $25,000/yr can offset ordinary (W-2) income if you actively participate and your MAGI is under $100k (phasing out to $0 by $150k); unused losses carry forward. On sale, claimed depreciation is recaptured at up to 25%, and gains may owe capital-gains tax (a 1031 exchange can defer both). Figures are a year-1 estimate at your 24.0% rate — not tax advice; consult a CPA.
Schools (NCES district)
- District
- Avery ISD
- NCES district ID
- 4809060
- Math proficiency
- 55% ▲ 10.00%
- Reading proficiency
- 50% ▲ 15.00%
- Median HH income
- $40,345
- Composite
- 45.86/100
- National rank
- #5558
- State rank
- #306 of 1141 in TX
Livability — Avery
- Score
- 64/100
- State rank
- #807
- US rank
- #14695
Category grades
Schools grade is shown separately in the Schools card above.
Census & demographics
- Population (ZIP)
- 2,282
Population outlook (Red River County) Hauer SSP2
- Today (2025)
- 11,454 people
- By 2030
- 10,874 · -5.1%
- By 2040
- 9,715 · -15.2%
- By 2050
- 8,552 · -25.3%
- By 2075
- 6,042 · -47.2%
- By 2100
- 4,037 · -64.8%
Race, ethnicity, and origin ACS 2023
- Neighborhood character
- Predominantly White (83%)
- Race & ethnicity
- White 83% Hispanic / Latino 11% Two or more races 3% Black 2%
- Hispanic origin (detail)
- Mexican 8%
- Common ancestry
- Portuguese 1%
- Foreign-born
- 7% · Canada
- Languages at home
- 93% English-only · Spanish 7% Other Asian/Pacific 1%
Political lean MEDSL · Red River
- 2024 margin
- Solid R (+61.8) · D 19.0% · R 80.8%
- 2008→2024 swing
- -23.7pp toward R · 2008: -38.0pp · 2024: -61.8pp
- All cycles
- 2024: R+61.8 2020: R+56.3 2016: R+53.9 2012: R+40.7 2008: R+38.0
Not yet ingested
- Civics
- —
Market trends
- HPI YoY
- ▲ 11.63%
- Current HPI
- 181.4649
- Rent YoY
- —
- Metro
- —
- State GDP YoY
- ▲ 3.95%
- F500 in state
- 110
Industry mix (Fortune 500 HQ in TX)
| Industry | F500 HQs | Revenue |
|---|---|---|
| Energy | 16 | $1,198B |
|
||
| Technology | 5 | $198B |
|
||
| Engineering / Construction | 4 | $72B |
|
||
| Energy Services | 3 | $60B |
|
||
| Utilities | 3 | $41B |
|
||
| Healthcare | 2 | $330B |
|
||
Property tax history
+7.5%/yrLatest (2025): $2,358 · +15.8% YoY. Source: county tax records.
Cash-flow waterfall
monthlySold comps — $/sqft
last 12 mo · ≤1 miLoading sold comps…