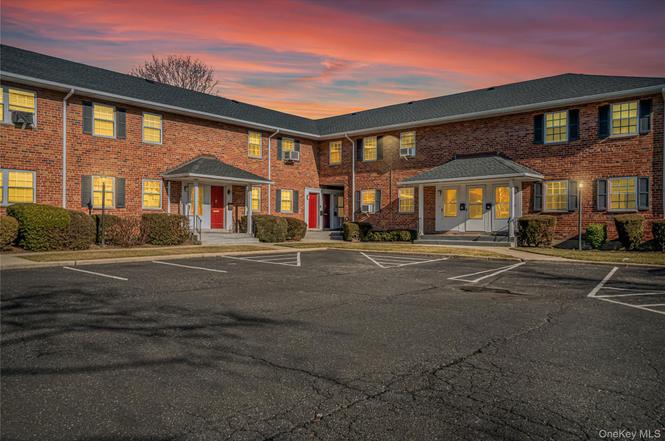
2551 Jerusalem Ave Unit 2S
North Bellmore, NY 11710
$399,000D
2 bd · 1.0 ba ·
845 sqft ·
Built 1965
· Condo
· Pending
· 16 DOM
Cashflow @ list (25.0% down · 7.5%)
Estimated rent
$3,400/mo
Mortgage (P&I)
−$2,092
Tax + insurance
−$665
HOA
−$0
Vac / Maint / Mgmt
−$714
Net cashflow
$-71/mo
Annual
$-857/yr
Cap rate
6.08%
Cash-on-cash
-0.77%
DSCR
0.97
1% rule
0.85%
Cash to close
$111,720
Investor read
- This is a 2-bed/1.0-bath condo listed at $399k.
- At list price, monthly cash flow is $-71 ($-857/yr) — negative.
- To cash-flow at today's rent, offer at most $389k (2.6% below list).
- To meet the 1% rule (rent ≥ 1% of price), the offer needs to be $340k (14.8% below list).
- It's been on market 16 days — a 2% lower offer ($393k) is reasonable based on typical stale-listing flexibility.
- Recommended offer: $340k (14.8% below list) — sets the bar for 1% rule.
- Local home prices are declining (-3.0%/yr); year-one equity from $3k of loan paydown is wiped out by about $12k of value loss. Plan a longer hold.
- Location reads 78/100 on livability (#158 in NY, #2,447 nationally) — a middle-class / working-renter tenant base. Strengths: commute A+, employment A+, housing A+; Watch: amenities F, cost of living F.
- North Bellmore Union Free School District (suburban): math 60% / reading 66% proficiency, ranked #151 of 590 in NY (top 26%) — acceptable for families but not a draw, mixed tenant base, ~2y average lease; only 8% free/reduced lunch — higher-income household profile.
- Zoned schools: Saw Mill Road School (math 54% / reading 62%, grade C+, #833 of 2,108 statewide, top 40%, 686 students, 13% FRL).
- Market conditions: 142 active listings in the ZIP; 1 comparable units currently listed for rent nearby; 824 units permitted in Nassau County in 2024 (153 in 5+ unit buildings).
- Nassau County population projected at +7% by 2050 — modest demand growth; plan on rents tracking national, not racing it.
- Climate carrying-cost: major wind risk, 60% chance of damaging wind over 30y; extreme-heat days projected 7→16/yr by 2055 (HVAC capex compounding) — expect insurance premiums to compound above CPI over the hold.
- Cap rate 6.1% vs local median 1.8% in North Bellmore — top-decile yield for the area; either an underpriced asset or a hidden risk that comps aren't pricing in. Stress-test before assuming the spread holds.
Questions for listing agent
- What do current leases actually rent for vs. the listed asking? Can we see a recent rent roll and the last 12 months of T-12 income?
- Built in 1965 — when were the roof, HVAC, electrical panel, plumbing, and water heater last replaced?
- Any open or pending special assessments — roof, HVAC, plumbing, elevator, façade? What's the per-unit balance and payoff schedule, and is the seller paying it off at close or rolling it to the buyer?
- Is there a deadline driving the sale (1031 exchange, divorce, estate, relocation)? That informs how much negotiation room exists.
- Schools are A-rated — typically a magnet for longer-tenancy family renters. What's the average tenant stay here, and is there a school-zone premium baked into asking?
- The area grade is low — what's the realistic commute time and amenity access for the typical tenant pool here? Any planned neighborhood developments (good or bad) we should know about?
- What's the average days-on-market for RENTAL listings here right now (not sales)? A rising rental-DOM trend means longer vacancies and softer asking-rent achievability than the comps imply.
- What's the recent tenant-quality profile in this submarket — average credit score on applications, eviction rate, late-payment / NSF rate, and stable-employment percentage? A property-management company in the area should have these aggregated.
CashFlowRE · CFR-B9Q9XD2TPDF24R
· Data 2 weeks ago
cashflowre.app · 2026-05-29