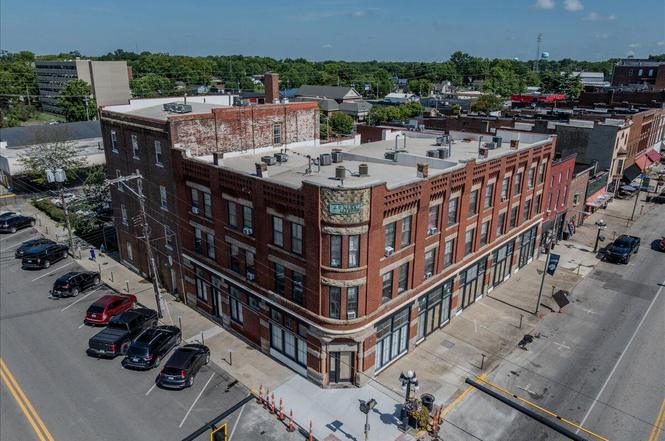
2 N Main St
Winchester, KY 40391
$1,575,000C+
36 bd · 19.2 ba ·
26,124 sqft ·
Built —
· MultiFamily
· Active
· 269 DOM
Cashflow @ list (25.0% down · 7.5%)
Estimated rent
$19,629/mo
Mortgage (P&I)
−$8,259
Tax + insurance
−$2,625
HOA
−$0
Vac / Maint / Mgmt
−$4,122
Net cashflow
$4,622/mo
Annual
$55,469/yr
Cap rate
9.81%
Cash-on-cash
12.58%
DSCR
1.56
1% rule
1.25%
Cash to close
$441,000
Investor read
- This is a 12 × 3-bed/1.6-bath units multifamily listed at $1.57M.
- At list price, monthly cash flow is $5k ($55k/yr) — positive. Per door: $385/mo.
- The deal already cash-flows at list — no discount required.
- Meets the 1% rule at list price ($20k rent vs $1.57M).
- It's been on market 269 days — a 12% lower offer ($1.39M) is reasonable based on typical stale-listing flexibility.
- Recommended offer: $1.39M (12.0% below list) — sets the bar for market timing.
- Local home prices are declining (-3.0%/yr); year-one equity from $11k of loan paydown is wiped out by about $47k of value loss. Plan a longer hold.
- Location reads 60/100 on livability (#393 in KY) — a middle-class / working-renter tenant base. Strengths: cost of living A+, housing A+; Watch: amenities F, commute F, employment F.
- Clark County (town): math 28% / reading 41% proficiency, ranked #64 of 165 in KY (top 39%) — families likely to look elsewhere, expect single-tenant / working-renter base with shorter leases.
- Zoned schools: Willis H. Justice Elementary School (math 27% / reading 27%, grade F, #434 of 676 statewide, top 69%, 427 students, 66% FRL); Robert D. Campbell Jr. High (math 28% / reading 47%, grade F, #73 of 217 statewide, top 36%, 820 students, 57% FRL).
- Market conditions: 291 active listings in the ZIP; 160 units permitted in Clark County in 2024 (61 in 5+ unit buildings).
- Clark County population projected to shrink 7% by 2050 — rents likely to lag national; underwrite the cash flow, not the appreciation.
- 2 sale attempts with the ask held roughly flat each time — persistent listings suggest the price (not the market) is what's stuck; bring a comps-based counter.
- At projected returns (-3.0% appreciation + 3.0% rent growth), your $441k cash investment doubles in ~9 years — after that, you're playing with house money.
- Cap rate 9.8% vs local median 4.0% in Winchester — top-decile yield for the area; either an underpriced asset or a hidden risk that comps aren't pricing in. Stress-test before assuming the spread holds.
- At $19,629/mo this rent would consume 367% of the median local household income ($64k/yr) (locally 854% of renters already pay >50% of income on rent) — very limited rent-growth headroom before tenants either downsize or default.
Questions for listing agent
- It's been on market 269 days. Have you received any prior offers? Is the seller open to a 12% concession, seller financing, or rate buy-down credit?
- Can we see the unit-by-unit rent roll, current vacancy, and any below-market leases? What's the average tenancy length?
- What capital expenditures (roof, boiler, parking lot, exteriors) have been made in the last 5 years, and what's planned in the next 2?
- Why hasn't it sold? Are there any deal-killer items the seller is aware of (foundation, flood, title, zoning, code violations)?
- Is there a deadline driving the sale (1031 exchange, divorce, estate, relocation)? That informs how much negotiation room exists.
- Schools are D-rated, which usually means shorter tenancies and higher turnover. Who's the typical renter profile here, and what's been the actual vacancy rate?
- What's the average days-on-market for RENTAL listings here right now (not sales)? A rising rental-DOM trend means longer vacancies and softer asking-rent achievability than the comps imply.
- What's the recent tenant-quality profile in this submarket — average credit score on applications, eviction rate, late-payment / NSF rate, and stable-employment percentage? A property-management company in the area should have these aggregated.
CashFlowRE · CFR-BAJVA49D8HCJ8Q
· Data 2 days ago
cashflowre.app · 2026-05-29