 12-Plex
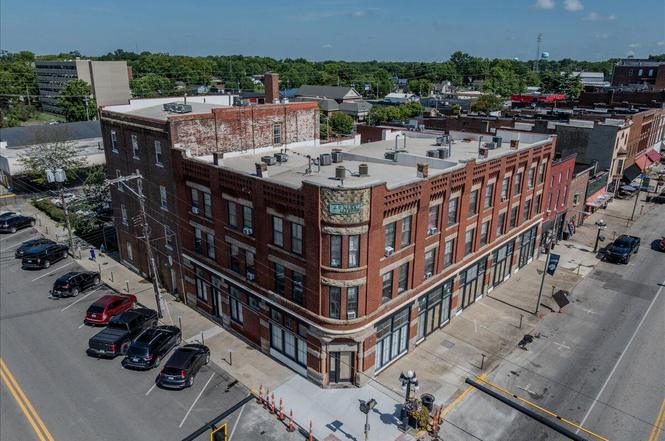
2 N Main St · Winchester, KY
Flood risk No data
- FEMA flood zone
- —
- Chance of flooding over 30 yrs
- —
- Est. flood insurance / yr
- —
Fire risk No data
- Est. fire insurance / yr
- —
Heat risk No data
- Hot days now (above threshold)
- —
- Hot days in 30 yrs
- —
Wind risk No data
- Chance of severe wind over 30 yrs
- —
Air-quality risk No data
- Unhealthy air days now
- —
- Unhealthy air days in 30 yrs
- —
Risk factors via First Street. Map © Google.
Why this score? — see what drove the C+ grade
The composite is a weighted blend of 9 inputs, each scored 0–100. Each bar is that input's sub-score; the figure is the points it added to the 100-point composite (weight × sub-score).
- Cash flow +27.4/30.0
- DSCR +9.6/10.0
- 1% rule +7.5/10.0
- ARV discount +7.5/15.0
- Schools +3.0/10.0
- Livability +3.0/5.0
- Rent growth +2.5/5.0
- Condition / age +2.5/5.0
- Appreciation +0.0/10.0
$1,575,000
🖨 Deal sheet 📄 Offer letter ✓ Due diligence
Multi-family units
County records classify this as Multi-Family (5+ Unit). Listing-text estimate: 12 units. confirmed
5+ unit building — per-unit beds/baths from public records are typically unavailable; the breakdown below (if shown) is an estimate from the listing text.
Listing remarks
Major CAPEX in 2022 & 2024 — Facade transformation, fully restored and renovated. Current grossing $168,000 annual rent, with $4,000/month upside — beats the 1% rule! The Kerr Building, the largest downtown historical landmark, features structural repairs, new roofing, brick tuck-pointing, secure key-fob entrances, central HVAC, modern kitchens, updated baths, and new flooring. 18 LIHTC apartments and 2 renovated ground-floor offices totaling 20 income-producing units. Additional space at 4-10 Main Street offers a blank canvas for tenant improvements and added cash flow. Downtown Winchester is thriving — turn-key, stabilized, and priced to sell. Seize this opportu
Key facts
- Central hvac
- Fully restored
- New roofing
Tags
Property features AI
Finance
- Financial info: 20 total units
Exterior
- Home design: 4-story building; Total building area approximately 26,124
- Construction: Parcel number 054-3209-018-020
- Exterior features: Lot in a business zoning area; Located in the Downtown subdivision; Property is near downtown Main and Broadway
Interior
- Bathrooms: 19 full bathrooms; 1 half bathroom
- Interior features: Located downtown
Neighborhood map
What this means for you Summary
Snapshot
- This is a 12 × 3-bed/1.6-bath units multifamily listed at $1.57M.
Deal economics
- At list price, monthly cash flow is $5k ($55k/yr) — positive. Per door: $385/mo.
- The deal already cash-flows at list — no discount required.
- Meets the 1% rule at list price ($20k rent vs $1.57M).
- Recommended offer: $1.39M (12.0% below list) — sets the bar for market timing.
- Cap rate 9.8% vs local median 4.0% in Winchester — top-decile yield for the area; either an underpriced asset or a hidden risk that comps aren't pricing in. Stress-test before assuming the spread holds.
Location & tenants
- Location reads 60/100 on livability (#393 in KY) — a middle-class / working-renter tenant base. Strengths: cost of living A+, housing A+; Watch: amenities F, commute F, employment F.
- Clark County (town): math 28% / reading 41% proficiency, ranked #64 of 165 in KY (top 39%) — families likely to look elsewhere, expect single-tenant / working-renter base with shorter leases.
- Zoned schools: Willis H. Justice Elementary School (math 27% / reading 27%, grade F, #434 of 676 statewide, top 69%, 427 students, 66% FRL); Robert D. Campbell Jr. High (math 28% / reading 47%, grade F, #73 of 217 statewide, top 36%, 820 students, 57% FRL).
- Market conditions: 291 active listings in the ZIP; 160 units permitted in Clark County in 2024 (61 in 5+ unit buildings).
- At $19,629/mo this rent would consume 367% of the median local household income ($64k/yr) (locally 854% of renters already pay >50% of income on rent) — very limited rent-growth headroom before tenants either downsize or default.
Forward outlook
- Local home prices are declining (-3.0%/yr); year-one equity from $11k of loan paydown is wiped out by about $47k of value loss. Plan a longer hold.
- Clark County population projected to shrink 7% by 2050 — rents likely to lag national; underwrite the cash flow, not the appreciation.
- At projected returns (-3.0% appreciation + 3.0% rent growth), your $441k cash investment doubles in ~9 years — after that, you're playing with house money.
Negotiation context
- It's been on market 269 days — a 12% lower offer ($1.39M) is reasonable based on typical stale-listing flexibility.
- 2 sale attempts with the ask held roughly flat each time — persistent listings suggest the price (not the market) is what's stuck; bring a comps-based counter.
Questions for the listing agent
- It's been on market 269 days. Have you received any prior offers? Is the seller open to a 12% concession, seller financing, or rate buy-down credit?
- Can we see the unit-by-unit rent roll, current vacancy, and any below-market leases? What's the average tenancy length?
- What capital expenditures (roof, boiler, parking lot, exteriors) have been made in the last 5 years, and what's planned in the next 2?
- Why hasn't it sold? Are there any deal-killer items the seller is aware of (foundation, flood, title, zoning, code violations)?
- Is there a deadline driving the sale (1031 exchange, divorce, estate, relocation)? That informs how much negotiation room exists.
- Schools are D-rated, which usually means shorter tenancies and higher turnover. Who's the typical renter profile here, and what's been the actual vacancy rate?
- What's the average days-on-market for RENTAL listings here right now (not sales)? A rising rental-DOM trend means longer vacancies and softer asking-rent achievability than the comps imply.
- What's the recent tenant-quality profile in this submarket — average credit score on applications, eviction rate, late-payment / NSF rate, and stable-employment percentage? A property-management company in the area should have these aggregated.
- How much new apartment / multifamily construction is in the pipeline within 1–3 miles? Heavy new supply (>2% of stock underway) typically softens rents 12–24 months out; light construction supports rent growth.
Investment metrics
- 1% rule
- 1.25% ✓
- Cap rate
- 9.81%
- Cash-on-cash
- 12.58%
- DSCR
- 1.56
- GRM
- 6.7
CMA / ARV
No comps found within radius.
Projected returns pro-forma
-3.0% appreciation · 3.0% rent growth · sell at horizon
- IRR
- 2.3%
- Equity multiple
- 1.09×
- Total profit
- $39,484
- Equity at exit
- $234,838
- IRR
- 11.9%
- Equity multiple
- 1.94×
- Total profit
- $414,680
- Equity at exit
- $136,177
Cash invested: $441,000 (down + closing). Projections, not guarantees.
Landlord ↔ Tenant lean methodology
- Overall (STATE)
- 83 Strongly Landlord-Friendly
- State Kentucky
- 83 Strongly Landlord-Friendly · R+16
- County
- — inherits STATE
- City
- — inherits STATE
ZIP-level market 40391
- Home prices YoY
- -17.0%
- Active inventory
- 291
- Price-to-rent
- 80.2×
Monthly cashflow live
- Estimated rent
- $19,629 high interval (Pro) →
- Mortgage (P&I)
- −$8,259
- Tax est. 1.5%
- −$1,969 /mo · $23,625/yr
- Insurance
- −$656
- HOA
- −$0
- Vacancy / Maint / Mgmt
- −$4,122
- Net cashflow
- $4,622
Break-even live
12-unit breakdown (identical units grouped — click to expand)
| Units | Beds | Baths | Est. rent |
|---|---|---|---|
| 12× units | 3 | 1.6 | $19,632 |
| #1 | 3 | 1.6 | $1,636 |
| #2 | 3 | 1.6 | $1,636 |
| #3 | 3 | 1.6 | $1,636 |
| #4 | 3 | 1.6 | $1,636 |
| #5 | 3 | 1.6 | $1,636 |
| #6 | 3 | 1.6 | $1,636 |
| #7 | 3 | 1.6 | $1,636 |
| #8 | 3 | 1.6 | $1,636 |
| #9 | 3 | 1.6 | $1,636 |
| #10 | 3 | 1.6 | $1,636 |
| #11 | 3 | 1.6 | $1,636 |
| #12 | 3 | 1.6 | $1,636 |
| Total (12 units) | $19,629 | ||
UW: 25.0% down · 7.5% · 30yr · 1.5% tax · 5.0% vac · 8.0% maint · 8.0% mgmt
Financing live
Cash to close
- Down payment
- $393,750
- Closing costs
- $47,250
- Reserves months
- —
- Total cash needed
- —
Loan-product check · same deal, 3 products live
Conventional
25% down · 7.5% · 30yr
- Down + closing
- —
- Monthly P&I
- —
- Monthly cashflow
- —
- DSCR
- —
- Eligible?
- —
Personal DTI + credit; lowest rate.
DSCR
20% down · 8.5% · 30yr
- Down + closing
- —
- Monthly P&I
- —
- Monthly cashflow
- —
- DSCR
- —
- Eligible?
- —
No personal income docs; deal must DSCR.
Hard money
10% down · 12.0% · 12mo
- Down + closing
- —
- Monthly P&I
- —
- Monthly cashflow
- —
- DSCR
- —
- Eligible?
- —
Short-term bridge; refi at stabilization.
Listing history 20 events
-
2026-06-18days on market $1,575,000 Active 269 DOM
-
2026-06-17days on market $1,575,000 Active 268 DOM
-
2026-06-16days on market $1,575,000 Active 267 DOM
-
2026-06-15days on market $1,575,000 Active 266 DOM
-
2026-06-14days on market $1,575,000 Active 264 DOM
-
2026-06-13days on market $1,575,000 Active 263 DOM
-
2026-06-10days on market $1,575,000 Active 261 DOM
-
2026-06-09days on market $1,575,000 Active 260 DOM
-
2026-06-08days on market $1,575,000 Active 259 DOM
-
2026-06-07days on market $1,575,000 Active 258 DOM
-
2026-06-05days on market $1,575,000 Active 255 DOM
-
2026-06-03days on market $1,575,000 Active 254 DOM
-
2026-06-02days on market $1,575,000 Active 253 DOM
-
2026-06-01days on market $1,575,000 Active 252 DOM
-
2026-05-31days on market $1,575,000 Active 251 DOM
-
2026-05-31days on market $1,575,000 Active 250 DOM
-
2026-04-07price $1,575,000
-
2026-02-13status Active
-
2025-12-31historical
-
2025-08-09$1,595,000 Active
ⓘ Source: listings_history table (triggers on properties + properties_extension) + one-shot
backfill from property_details.listing_events for pre-trigger history.
Nearby sold comps map
Loading sold comps map…
Walkable amenities ~0.75 mi
Loading nearby amenities…
Taxation est. · year 1
- Rental income
- $235,548
- − Mortgage interest
- −$88,224
- − Property taxes
- −$23,625
- − Insurance
- −$7,875
- − Repairs & maintenance
- −$18,844
- − Management
- −$18,844
- − Depreciation
- −$45,818
- Taxable income
- $32,318
- Est. tax owed @ 24.0%
- −$7,756
- After-tax cash flow
- $47,713/yr
For passive investors: Depreciation is non-cash, so a rental often shows a tax loss while cash-flowing — sheltering income. Rental losses are passive: they offset passive income freely, and up to $25,000/yr can offset ordinary (W-2) income if you actively participate and your MAGI is under $100k (phasing out to $0 by $150k); unused losses carry forward. On sale, claimed depreciation is recaptured at up to 25%, and gains may owe capital-gains tax (a 1031 exchange can defer both). Figures are a year-1 estimate at your 24.0% rate — not tax advice; consult a CPA.
Schools (NCES district)
- District
- Clark County
- NCES district ID
- 2101200
- Math proficiency
- 28% ▼ -25.00%
- Reading proficiency
- 41% ▼ -18.00%
- Median HH income
- $47,282
- Composite
- 29.63/100
- National rank
- #6469
- State rank
- #64 of 165 in KY
Livability — Winchester
- Score
- 60/100
- State rank
- #393
- US rank
- #18931
Category grades
Schools grade is shown separately in the Schools card above.
Census & demographics
- Census place
- Winchester, KY
- County
- Clark County · 36,796 people
- City population
- 36,796
- Metro
- Lexington-Fayette, KY
- Population (ZIP)
- 36,796
- Household income
- $64,144
- Rent vs Own
- Severe rent burden
- 854.0
Population outlook (Clark County) Hauer SSP2
- Today (2025)
- 35,849 people
- By 2030
- 35,616 · -0.6%
- By 2040
- 34,727 · -3.1%
- By 2050
- 33,195 · -7.4%
- By 2075
- 29,439 · -17.9%
- By 2100
- 24,744 · -31.0%
Race, ethnicity, and origin ACS 2023
- Neighborhood character
- Predominantly White (88%)
- Race & ethnicity
- White 88% Black 4% Hispanic / Latino 4% Two or more races 3%
- Common ancestry
- Slovak 3% Italian 2% Serbian 2%
- Foreign-born
- 2% · Canada
- Languages at home
- 97% English-only · Spanish 2%
Political lean MEDSL · Clark
- 2024 margin
- Solid R (+35.3) · D 31.6% · R 66.9% · Other 1.6%
- 2008→2024 swing
- -10.3pp toward R · 2008: -25.1pp · 2024: -35.3pp
- All cycles
- 2024: R+35.3 2020: R+32.0 2016: R+37.1 2012: R+30.5 2008: R+25.1
Not yet ingested
- Civics
- —
Market trends
- HPI YoY
- ▼ -58.24%
- Current HPI
- 283.7839
- Rent YoY
- —
- Metro
- Lexington-Fayette, KY
- State GDP YoY
- ▲ 1.81%
- F500 in state
- 4
Industry mix (Fortune 500 HQ in KY)
| Industry | F500 HQs | Revenue |
|---|---|---|
| Healthcare | 1 | $118B |
|
||
| Food / Beverage | 1 | $7B |
|
||
Price history
-1.3% since first listed4 events — show timeline
- 2026-04-07 Price Changed $1,575,000 ImagineMLS
- 2026-02-13 Relisted — ImagineMLS
- 2025-12-31 Listing Removed — ImagineMLS
- 2025-08-09 Listed $1,595,000 ImagineMLS
Property tax history
+2.8%/yrLatest (2016): $2,461 · +2.5% YoY. Source: county tax records.
Cash-flow waterfall
monthlySold comps — $/sqft
last 12 mo · ≤1 miLoading sold comps…