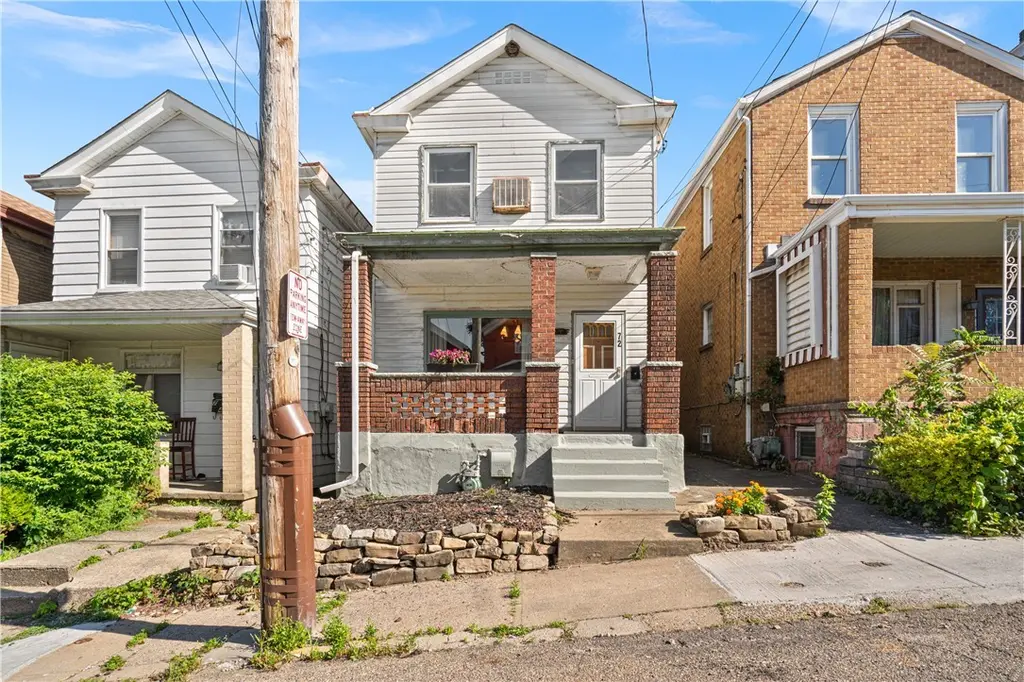
72 Frazier Ave
McKees Rocks, PA 15136
$79,900B+
3 bd · 1.0 ba ·
1,496 sqft ·
Built 1900
· SingleFamily
· Active
· 12 DOM
Cashflow @ list (25.0% down · 7.5%)
Estimated rent
$1,415/mo
Mortgage (P&I)
−$419
Tax + insurance
−$243
HOA
−$0
Vac / Maint / Mgmt
−$297
Net cashflow
$455/mo
Annual
$5,465/yr
Cap rate
13.13%
Cash-on-cash
24.43%
DSCR
2.09
1% rule
1.77%
Cash to close
$22,372
Investor read
- This is a 3-bed/1.0-bath single-family listed at $80k.
- At list price, monthly cash flow is $455 ($5k/yr) — positive.
- The deal already cash-flows at list — no discount required.
- Meets the 1% rule at list price ($1k rent vs $80k).
- Only 12 days on market — expect competitive offers; lowballing is unlikely to land.
- Local home prices are declining (-3.0%/yr); year-one equity from $552 of loan paydown is wiped out by about $2k of value loss. Plan a longer hold.
- Location reads 82/100 on livability (#143 in PA, #1,154 nationally) — a professional / high-income tenant draw. Strengths: amenities A+, commute A+, cost of living A+; Watch: employment F.
- Sto-Rox SD (suburban): math 4% / reading 18% proficiency, ranked #532 of 539 in PA (top 99%) — low school quality limits family demand, transient renter base, plan for 1-2y turnover; 77% free/reduced lunch — lower-income household profile, screen leases tightly.
- Zoned schools: Sto-Rox Primary Ctr (math 8% / reading 27%, grade F, #1,295 of 1,518 statewide, top 86%, 328 students, 100% FRL); Sto-Rox Upper El Sch (math 3% / reading 20%, grade F, #492 of 512 statewide, top 96%, 218 students, 100% FRL); Sto-Rox Jshs (math 2% / reading 2%, grade F, #437 of 437 statewide, top 100%, 517 students, 92% FRL) — zoned schools average 98% FRL vs 77% district-wide (20 pts higher); higher-poverty schools than district average — tighter screening recommended.
- Watch-outs: property tax is 3.2% of price; built in 1900 — expect roof / HVAC / electrical / plumbing capex.
- Market conditions: Rents rising fast (+13.1%/yr); 126 active listings in the ZIP; 23 comparable units currently listed for rent nearby; rentals at typical pace (median 25d on market — plan ~3-4 weeks tenant-placement turnaround); 2,996 units permitted in Allegheny County in 2024 (1,588 in 5+ unit buildings).
- At projected returns (-3.0% appreciation + 8.0% rent growth), your $22k cash investment doubles in ~5 years — after that, you're playing with house money.
- Cap rate 13.1% vs local median 10.0% in McKees Rocks — top-decile yield for the area; either an underpriced asset or a hidden risk that comps aren't pricing in. Stress-test before assuming the spread holds.
Questions for listing agent
- Built in 1900 — when were the roof, HVAC, electrical panel, plumbing, and water heater last replaced?
- Property tax is high relative to price — has the assessment been appealed recently, and will the sale trigger a re-assessment?
- Is there a deadline driving the sale (1031 exchange, divorce, estate, relocation)? That informs how much negotiation room exists.
- Schools are F-rated, which usually means shorter tenancies and higher turnover. Who's the typical renter profile here, and what's been the actual vacancy rate?
- What's the average days-on-market for RENTAL listings here right now (not sales)? A rising rental-DOM trend means longer vacancies and softer asking-rent achievability than the comps imply.
- What's the recent tenant-quality profile in this submarket — average credit score on applications, eviction rate, late-payment / NSF rate, and stable-employment percentage? A property-management company in the area should have these aggregated.
- How much new for-sale + rental construction is in the pipeline within 1–3 miles? Heavy new supply typically softens prices + rents 12–24 months out; constrained supply supports both.
CashFlowRE · CFR-BBADQ6BBVA06ER
· Data 17 h ago
cashflowre.app · 2026-05-29