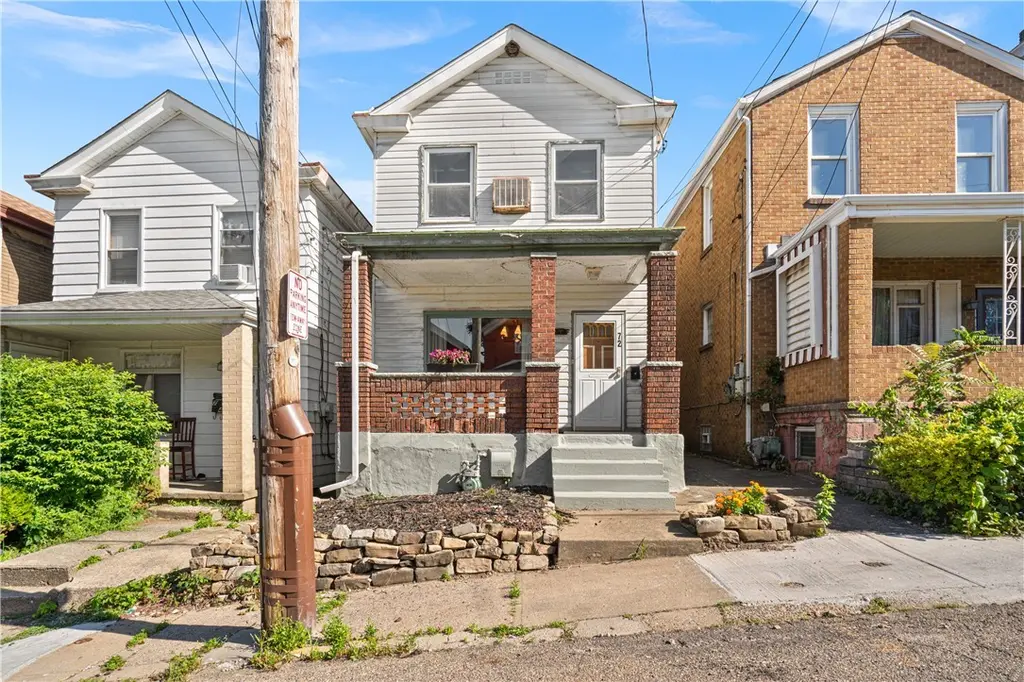
72 Frazier Ave · McKees Rocks, PA
Flood risk 1/10 · Minimal
- FEMA flood zone
- X (unshaded)
- Chance of flooding over 30 yrs
- 0.0%
- Est. flood insurance / yr
- $473 – $860
Fire risk 1/10 · Minimal
- Est. fire insurance / yr
- $511 – $949
Heat risk 4/10 · Minor
- Hot days now (above 98°F)
- 7 days/yr
- Hot days in 30 yrs
- 17 days/yr
Wind risk 2/10 · Minimal
- Chance of severe wind over 30 yrs
- —
Air-quality risk 3/10 · Minor
- Unhealthy air days now
- 3 days/yr
- Unhealthy air days in 30 yrs
- 3 days/yr
Risk factors via First Street. Map © Google.
Why this score? — see what drove the B+ grade
The composite is a weighted blend of 9 inputs, each scored 0–100. Each bar is that input's sub-score; the figure is the points it added to the 100-point composite (weight × sub-score).
- Cash flow +30.0/30.0
- ARV discount +15.0/15.0
- 1% rule +10.0/10.0
- DSCR +10.0/10.0
- Rent growth +5.0/5.0
- Livability +4.1/5.0
- Condition / age +2.5/5.0
- Schools +0.9/10.0
- Appreciation +0.0/10.0
$79,900
🖨 Deal sheet (PDF) 📄 Offer letter ✓ Due diligence
Listing remarks
Step back in time to a one-of-a-kind home that's been in the same family for generations. Convenient location within a short drive to the stadiums, casino and the upcoming Esplanade Park. Walking distance to the theatre, brewery, Mancini's bakery and a variety of family-owned restaurants and businesses that give McKees Rocks that small town feel right outside the city. You're welcomed by covered front and rear porches plus two convenient off-street parking spaces. Enjoy low maintenance landscaping with absolutely no grass to cut! The first floor has an added full bathroom, spacious dining room and a large eat-in kitchen. Abundant storage with functional and creative closet space in every no
Key facts
- Large eat-in kitchen
- Spacious dining room
- Added full bathroom
Tags
Property features AI
Exterior
- Parking: Off-street parking for 2 vehicles
- Utilities: Public water; Public sewer
- Home design: 2-story residence; Resale property
- Construction: Brick and frame construction; Composition roof
- Exterior features: Small lot (approximately 0.0413 acres)
Interior
- Bedrooms: Upper level bedroom (one shown with 15 x 15 dimensions)
- Flooring: Carpet flooring
- Bathrooms: 2 full bathrooms
- Heating & cooling: Forced air heating; Gas heating
- Interior features: Decorative fireplace; Unfinished walk-up basement
- Laundry & utility: Lower level laundry
Neighborhood map
What this means for you Summary
Snapshot
- This is a 3-bed/1.0-bath single-family listed at $80k.
Deal economics
- At list price, monthly cash flow is $455 ($5k/yr) — positive.
- The deal already cash-flows at list — no discount required.
- Meets the 1% rule at list price ($1k rent vs $80k).
- Cap rate 13.1% vs local median 10.0% in McKees Rocks — top-decile yield for the area; either an underpriced asset or a hidden risk that comps aren't pricing in. Stress-test before assuming the spread holds.
Location & tenants
- Location reads 82/100 on livability (#143 in PA, #1,154 nationally) — a professional / high-income tenant draw. Strengths: amenities A+, commute A+, cost of living A+; Watch: schools F, employment F.
- Sto-Rox SD (suburban): math 4% / reading 18% proficiency, ranked #532 of 539 in PA (top 99%) — low school quality limits family demand, transient renter base, plan for 1-2y turnover; 77% free/reduced lunch — lower-income household profile, screen leases tightly.
- Market conditions: Rents rising fast (+13.1%/yr); 127 active listings in the ZIP; 23 comparable units currently listed for rent nearby; rentals at typical pace (median 25d on market — plan ~3-4 weeks tenant-placement turnaround); 2,996 units permitted in Allegheny County in 2024 (1,588 in 5+ unit buildings).
Forward outlook
- Local home prices are declining (-3.0%/yr); year-one equity from $552 of loan paydown is wiped out by about $2k of value loss. Plan a longer hold.
- At projected returns (-3.0% appreciation + 8.0% rent growth), your $22k cash investment doubles in ~5 years — after that, you're playing with house money.
Negotiation context
- Only 12 days on market — expect competitive offers; lowballing is unlikely to land.
Risks & watch-outs
- Watch-outs: property tax is 3.2% of price; built in 1900 — expect roof / HVAC / electrical / plumbing capex.
Questions for the listing agent
- Built in 1900 — when were the roof, HVAC, electrical panel, plumbing, and water heater last replaced?
- Property tax is high relative to price — has the assessment been appealed recently, and will the sale trigger a re-assessment?
- Is there a deadline driving the sale (1031 exchange, divorce, estate, relocation)? That informs how much negotiation room exists.
- Schools are F-rated, which usually means shorter tenancies and higher turnover. Who's the typical renter profile here, and what's been the actual vacancy rate?
- What's the average days-on-market for RENTAL listings here right now (not sales)? A rising rental-DOM trend means longer vacancies and softer asking-rent achievability than the comps imply.
- What's the recent tenant-quality profile in this submarket — average credit score on applications, eviction rate, late-payment / NSF rate, and stable-employment percentage? A property-management company in the area should have these aggregated.
- How much new for-sale + rental construction is in the pipeline within 1–3 miles? Heavy new supply typically softens prices + rents 12–24 months out; constrained supply supports both.
Investment metrics
- 1% rule
- 1.77% ✓
- Cap rate
- 13.13%
- Cash-on-cash
- 24.43%
- DSCR
- 2.09
- GRM
- 4.7
CMA / ARV
- ARV (on-the-fly)
- $124,168
- Comps found
- 12
Show comp detail 12 sales within ~0.75 mi
| Address | Dist | Beds/Ba | Sqft | Sold | Price | $/sf | Match |
|---|---|---|---|---|---|---|---|
| 27 Highland Ave | 0.15mi | 3/1.0 | 1,488 (-0%) | 5mo | $66,000 | $44 | 88 |
| 67 Rosamond St | 0.43mi | 3/2.0 | 1,545 (+3%) | 0mo | $128,000 | $83 | 70 |
| 1109 Progress St | 0.52mi | 3/2.0 | 1,477 (-1%) | 3mo | $77,000 | $52 | 67 |
| 810 10th St | 0.41mi | 4/2.0 (+1) | 1,408 (-6%) | 4mo | $80,000 | $57 | 59 |
| 747 Chartiers Ave | 0.67mi | 3/1.0 | 1,616 (+8%) | 0mo | $105,000 | $65 | 55 |
| 813 13th St | 0.54mi | 2/2.0 (-1) | 1,404 (-6%) | 4mo | $143,000 | $102 | 53 |
| 127 Amelia St | 0.57mi | 4/2.0 (+1) | 1,625 (+9%) | 1mo | $190,000 | $117 | 50 |
| 202 Jane St | 0.47mi | 3/2.0 | 1,280 (-14%) | 5mo | $90,000 | $70 | 46 |
| 109 Helen St | 0.71mi | 3/3.0 | 1,582 (+6%) | 5mo | $100,000 | $63 | 45 |
| 735 Boquet St | 0.63mi | 3/1.5 | 1,292 (-14%) | 3mo | $140,000 | $108 | 43 |
| 557 Hillcrest Ave | 0.75mi | 3/2.5 | 1,610 (+8%) | 4mo | $235,000 | $146 | 43 |
| 543 Elizabeth Ave | 0.70mi | 4/1.0 (+1) | 1,291 (-14%) | 4mo | $155,000 | $120 | 36 |
Match score weights: distance 35% · size 25% · config 20% · recency 20%. Top-matched comps best support the ARV.
Projected returns pro-forma
-3.0% appreciation · 8.0% rent growth · sell at horizon
- IRR
- 23.9%
- Equity multiple
- 2.06×
- Total profit
- $23,626
- Equity at exit
- $11,913
- IRR
- 35.1%
- Equity multiple
- 5.13×
- Total profit
- $92,323
- Equity at exit
- $6,908
Cash invested: $22,372 (down + closing). Projections, not guarantees.
Landlord ↔ Tenant lean methodology
- Overall (STATE)
- 62 Landlord-Friendly
- State Pennsylvania
- 62 Landlord-Friendly · EVEN
- County
- — inherits STATE
- City
- — inherits STATE
ZIP-level market 15136
- Home prices YoY
- -30.4%
- Rents YoY
- 13.1%
- Active inventory
- 127
- Price-to-rent
- 4.7×
Monthly cashflow live
- Estimated rent
- $1,415 high interval (Pro) →
- Mortgage (P&I)
- −$419
- Tax from tax record
- −$210 /mo · $2,522/yr
- Insurance
- −$33
- HOA
- −$0
- Vacancy / Maint / Mgmt
- −$297
- Net cashflow
- $455
Break-even live
Sensitivity live
| Price | -10% $501 | -5% $478 | +0% $455 | +5% $433 | +10% $410 |
|---|---|---|---|---|---|
| Rent | -10% $344 | -5% $400 | +0% $455 | +5% $511 | +10% $567 |
| Rate | -1.0pp $496 | -0.5pp $476 | base $455 | +0.5pp $435 | +1.0pp $414 |
UW: 25.0% down · 7.5% · 30yr · 1.5% tax · 5.0% vac · 8.0% maint · 8.0% mgmt
Financing live
Cash to close
- Down payment
- $19,975
- Closing costs
- $2,397
- Reserves months
- —
- Total cash needed
- —
Loan-product check · same deal, 3 products live
Conventional
25% down · 7.5% · 30yr
- Down + closing
- —
- Monthly P&I
- —
- Monthly cashflow
- —
- DSCR
- —
- Eligible?
- —
Personal DTI + credit; lowest rate.
DSCR
20% down · 8.5% · 30yr
- Down + closing
- —
- Monthly P&I
- —
- Monthly cashflow
- —
- DSCR
- —
- Eligible?
- —
No personal income docs; deal must DSCR.
Hard money
10% down · 12.0% · 12mo
- Down + closing
- —
- Monthly P&I
- —
- Monthly cashflow
- —
- DSCR
- —
- Eligible?
- —
Short-term bridge; refi at stabilization.
Rent comps 23 comps
| Address | Beds | Baths | Sqft | Rent | $/sqft | DOM | Units | Dist |
|---|---|---|---|---|---|---|---|---|
| 71 McKinnie Ave Mc Kees Rocks, PA | 2.0 | 1.0 | 1176 | $1,100 | $0.94 | 24d | 1 | 0.05mi |
| 27 Highland Ave Mc Kees Rocks, PA | 3.0 | 1.0 | 1488 | $1,425 | $0.96 | 24d | 1 | 0.14mi |
| 135 Dunn St Mc Kees Rocks, PA | 3.0 | 2.0 | 1600 | $1,599 | $1.00 | 21d | 1 | 0.14mi |
| 614 Woodward Ave McKees Rocks, PA | 2.0 | 1.0 | 1000 | $950 | $0.95 | 8d | 1 | 0.18mi |
| 504 Fair Oaks St Mc Kees Rocks, PA | 4.0 | 1.0 | 1480 | $1,195 | $0.81 | 24d | 1 | 0.22mi |
| 214 Erwin Pl Mc Kees Rocks, PA | 3.0 | 1.0 | 1026 | $1,685 | $1.64 | 44d | 1 | 0.29mi |
| 705 Russellwood Ave Unit 2ndFL McKees Rocks, PA | 4.0 | 1.0 | 1100 | $2,250 | $2.05 | 3d | 1 | 0.32mi |
| 705 Russellwood Ave Apt 2nd Floor McKees Rocks, PA | 4.0 | 1.0 | 1100 | $2,195 | $2.00 | 3d | 1 | 0.32mi |
| 1124a Dohrman St McKees Rocks, PA | 3.0 | 1.0 | 1150 | $1,250 | $1.09 | 24d | 1 | 0.37mi |
| 1126 Dohrman St Unit MC McKees Rocks, PA | 2.0 | 1.0 | 1200 | $1,250 | $1.04 | 44d | 1 | 0.38mi |
| 915 Woodward Ave Mc Kees Rocks, PA | 3.0 | 1.0 | 1224 | $1,399 | $1.14 | 44d | 1 | 0.41mi |
| 933 Woodward Ave Unit NA McKees Rocks, PA | 2.0 | 1.0 | 1100 | $1,400 | $1.27 | 21d | 1 | 0.44mi |
| 933 Woodward Ave Unit MC McKees Rocks, PA | 2.0 | 1.0 | 1100 | $1,400 | $1.27 | 24d | 1 | 0.44mi |
| 214 Wright St Unit Na McKees Rocks, PA | 2.0 | 1.0 | 954 | $1,175 | $1.23 | 15d | 1 | 0.45mi |
| 27 Rudolph St Mc Kees Rocks, PA | 3.0 | 1.0 | 1084 | $1,100 | $1.01 | 3d | 1 | 0.55mi |
| 802 13th St Unit 2 McKees Rocks, PA | 2.0 | 1.0 | 1100 | $920 | $0.84 | 44d | 1 | 0.55mi |
| 207 Singer Ave Mc Kees Rocks, PA | 3.0 | 2.0 | 1728 | $1,700 | $0.98 | 44d | 1 | 0.59mi |
| 907 Chartiers Ave Unit 2 McKees Rocks, PA | 2.0 | 1.0 | 900 | $1,100 | $1.22 | 24d | 1 | 0.60mi |
| 720 Mary St Mc Kees Rocks, PA | 4.0 | 2.0 | 1800 | $1,795 | $1.00 | 8d | 1 | 0.66mi |
| 33 Greenough Ave Pittsburgh, PA | 2.0 | 1.0 | 900 | $1,300 | $1.44 | 44d | 1 | 1.21mi |
| 10 Highland Dr Mc Kees Rocks, PA | 2.0 | 1.0 | 1188 | $1,300 | $1.09 | 44d | 1 | 1.24mi |
| 219 Woodlawn Ave Pittsburgh, PA | 2.0 | 1.0 | 925 | $1,075 | $1.16 | 44d | 1 | 1.34mi |
| 115 Meade Ave Pittsburgh, PA | 4.0 | 1.0 | 1392 | $1,600 | $1.15 | 44d | 1 | 1.43mi |
Listing history 8 events
-
2026-06-21days on market $79,900 Active 12 DOM
-
2026-06-18days on market $79,900 Active 9 DOM
-
2026-06-17days on market $79,900 Active 8 DOM
-
2026-06-16days on market $79,900 Active 7 DOM
-
2026-06-15days on market $79,900 Active 6 DOM
-
2026-06-13days on market $79,900 Active 4 DOM
-
2026-06-10remarks 699-char remark
-
2026-06-10$79,900 Active 1 DOM
ⓘ Source: listings_history table (triggers on properties + properties_extension) + one-shot
backfill from property_details.listing_events for pre-trigger history.
Tax reassessment forecast PA · Partial reset (capped growth)
- Current annual tax
- $2,522 · $210/mo
- Projected year-2 tax
- $2,522 · $210/mo
- Expected delta
- $0/yr ($0/mo · 0.0%)
ⓘ Screening estimate from a state-policy table — verify with the county assessor before closing.
Climate risk First Street
- Flood 1/10 Low FEMA zone X (unshaded) · 0% chance over 30 yrs
- Wildfire 1/10 Low
- Heat 4/10 Moderate 7 d/yr ≥98°F today · 17 d/yr by 30 yrs out
- Wind 2/10 Low
- Air quality 3/10 Moderate 3 unhealthy d/yr today · 3 by 30 yrs out
Nearby sold comps map
Loading sold comps map…
Walkable amenities ~0.75 mi
Loading nearby amenities…
Taxation est. · year 1
- Rental income
- $16,981
- − Mortgage interest
- −$4,476
- − Property taxes
- −$2,522
- − Insurance
- −$400
- − Repairs & maintenance
- −$1,358
- − Management
- −$1,358
- − Depreciation
- −$2,324
- Taxable income
- $4,542
- Est. tax owed @ 24.0%
- −$1,090
- After-tax cash flow
- $4,375/yr
For passive investors: Depreciation is non-cash, so a rental often shows a tax loss while cash-flowing — sheltering income. Rental losses are passive: they offset passive income freely, and up to $25,000/yr can offset ordinary (W-2) income if you actively participate and your MAGI is under $100k (phasing out to $0 by $150k); unused losses carry forward. On sale, claimed depreciation is recaptured at up to 25%, and gains may owe capital-gains tax (a 1031 exchange can defer both). Figures are a year-1 estimate at your 24.0% rate — not tax advice; consult a CPA.
Schools (NCES district)
- District
- Sto-Rox SD
- NCES district ID
- 4222830
- Math proficiency
- 4% ▼ -5.00%
- Reading proficiency
- 18% ▼ -4.00%
- Median HH income
- $30,268
- Composite
- 8.51/100
- National rank
- #9904
- State rank
- #532 of 539 in PA
Livability — McKees Rocks
- Score
- 82/100
- State rank
- #143
- US rank
- #1154
Category grades
Schools grade is shown separately in the Schools card above.
Census & demographics
- County
- Allegheny County · 1,022,028 people
- City population
- 22,623
- Metro
- Pittsburgh, PA
- Population (ZIP)
- 22,623
- Household income
- $69,099
- Rent vs Own
- Severe rent burden
- 768.0
Population outlook (Allegheny County) Hauer SSP2
- Today (2025)
- 1,250,282 people
- By 2030
- 1,256,482 · +0.5%
- By 2040
- 1,256,318 · +0.5%
- By 2050
- 1,244,169 · -0.5%
- By 2075
- 1,197,693 · -4.2%
- By 2100
- 1,093,187 · -12.6%
Race, ethnicity, and origin ACS 2023
- Neighborhood character
- Predominantly White (75%)
- Race & ethnicity
- White 75% Black 18% Two or more races 4% Hispanic / Latino 2%
- Common ancestry
- Romanian 10% Subsaharan African 3% Scotch-Irish 2%
- Foreign-born
- 3% · Canada
- Languages at home
- 96% English-only · Spanish 1% Other Indo-European 1%
Political lean MEDSL · Allegheny
- 2024 margin
- Strong D (+20.3) · D 59.7% · R 39.4%
- 2008→2024 swing
- +4.8pp toward D · 2008: 15.5pp · 2024: 20.3pp
- All cycles
- 2024: D+20.3 2020: D+20.4 2016: D+16.4 2012: D+14.4 2008: D+15.5
Not yet ingested
- Civics
- —
Market trends
- HPI YoY
- ▼ -107.07%
- Current HPI
- 244.6934
- Rent YoY
- ▲ 13.12%
- Metro
- Pittsburgh, PA
- State GDP YoY
- ▲ 1.68%
- F500 in state
- 34
Industry mix (Fortune 500 HQ in PA)
| Industry | F500 HQs | Revenue |
|---|---|---|
| Healthcare | 2 | $309B |
|
||
| Insurance | 2 | $27B |
|
||
| Telecommunications / Media | 1 | $124B |
|
||
| Industrial Distribution | 1 | $22B |
|
||
| Financial Services | 1 | $20B |
|
||
| Chemicals / Materials | 1 | $18B |
|
||
Price history
1 event — show timeline
- 2026-06-09 Listed $79,900 West Penn MLS
Property tax history
+4.5%/yrLatest (2026): $2,522 · +59.4% YoY. Source: county tax records.
Cash-flow waterfall
monthlySold comps — $/sqft
last 12 mo · ≤1 miLoading sold comps…