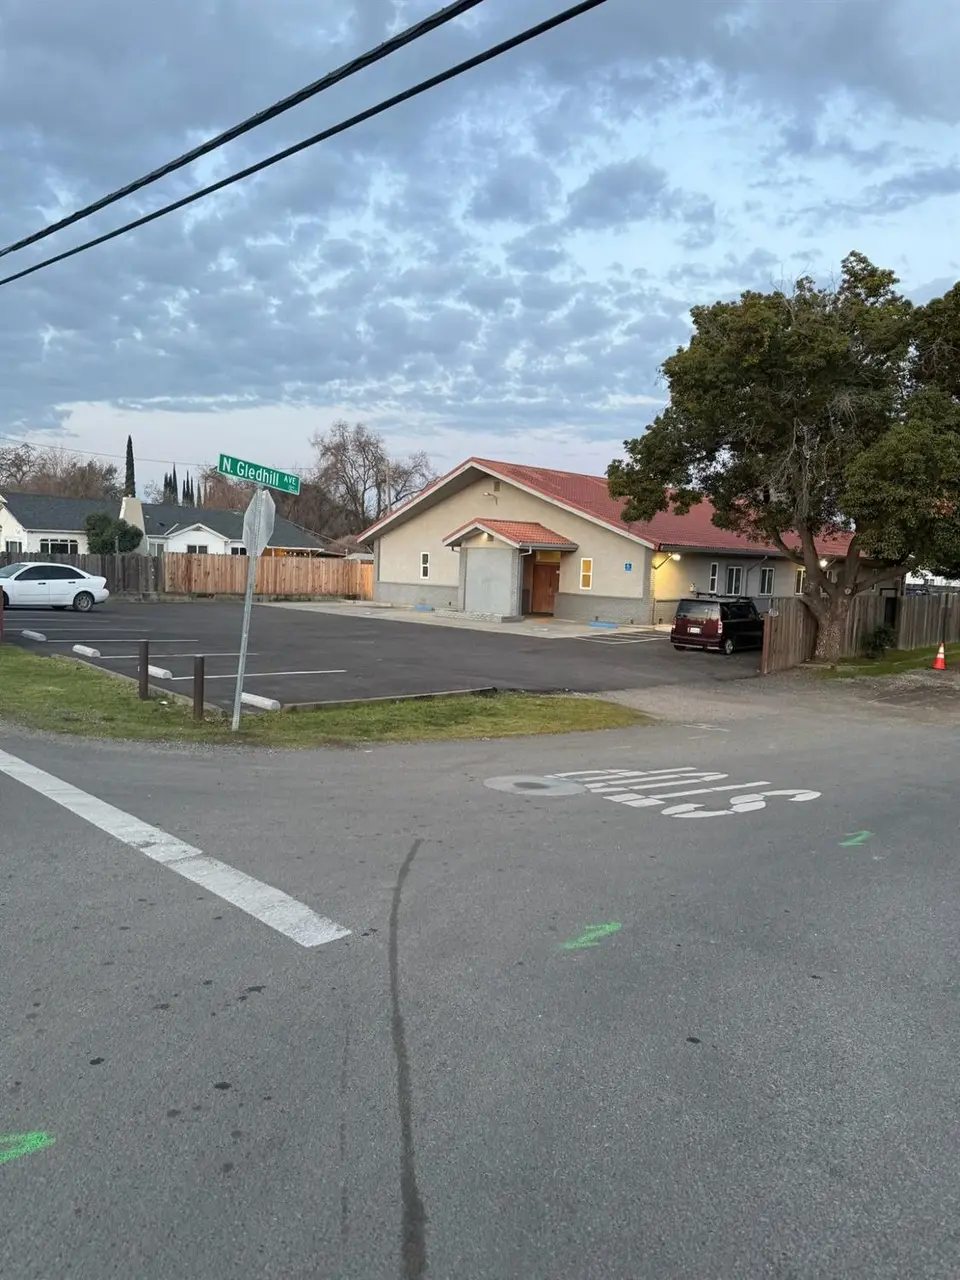
5638 N Gledhill Ave
Linda, CA 95961
$850,000B-
225 bd · None ba ·
4,680 sqft ·
Built 1992
· MultiFamily
· Active
· 497 DOM
Cashflow @ list (25.0% down · 7.5%)
Estimated rent
$20,439/mo
Mortgage (P&I)
−$4,457
Tax + insurance
−$1,417
HOA
−$0
Vac / Maint / Mgmt
−$4,292
Net cashflow
$10,273/mo
Annual
$123,272/yr
Cap rate
20.80%
Cash-on-cash
51.79%
DSCR
3.30
1% rule
2.40%
Cash to close
$238,000
Investor read
- This is a 15 × 1-bed/1-bath units multifamily listed at $850k. Condition is rated fair.
- At list price, monthly cash flow is $10k ($123k/yr) — positive. Per door: $685/mo.
- The deal already cash-flows at list — no discount required.
- Meets the 1% rule at list price ($20k rent vs $850k).
- It's been on market 497 days — a 12% lower offer ($748k) is reasonable based on typical stale-listing flexibility.
- Recommended offer: $748k (12.0% below list) — sets the bar for market timing.
- Local home prices are declining (-3.0%/yr); year-one equity from $6k of loan paydown is wiped out by about $26k of value loss. Plan a longer hold.
- Location reads 52/100 on livability (#995 in CA) — a working-class tenant base; expect higher turnover. Strengths: commute A+, housing A+; Watch: schools F, crime F, amenities F.
- Marysville Joint Unified (suburban): math 14% / reading 28% proficiency, ranked #455 of 517 in CA (top 88%) — low school quality limits family demand, transient renter base, plan for 1-2y turnover; 68% free/reduced lunch — lower-income household profile, screen leases tightly.
- Market conditions: 315 active listings in the ZIP; solid renter incomes; 750 units permitted in Yuba County in 2024 (41 in 5+ unit buildings).
- Yuba County population projected to shrink 3% by 2050 — rents likely to lag national; underwrite the cash flow, not the appreciation.
- At projected returns (-3.0% appreciation + 3.0% rent growth), your $238k cash investment doubles in ~3 years — after that, you're playing with house money.
- Climate carrying-cost: major flood risk; severe wildfire risk; extreme-heat days projected 7→16/yr by 2055 (HVAC capex compounding) — expect insurance premiums to compound above CPI over the hold.
- Cap rate 20.8% vs local median 2.8% in Linda — top-decile yield for the area; either an underpriced asset or a hidden risk that comps aren't pricing in. Stress-test before assuming the spread holds.
- At $20,439/mo this rent would consume 274% of the median local household income ($90k/yr) (locally 461% of renters already pay >50% of income on rent) — very limited rent-growth headroom before tenants either downsize or default.
Questions for listing agent
- It's been on market 497 days. Have you received any prior offers? Is the seller open to a 12% concession, seller financing, or rate buy-down credit?
- Can we see the unit-by-unit rent roll, current vacancy, and any below-market leases? What's the average tenancy length?
- What capital expenditures (roof, boiler, parking lot, exteriors) have been made in the last 5 years, and what's planned in the next 2?
- Have any recent inspections been done? Can we get a copy of the seller's disclosures and any deferred-maintenance estimates?
- Why hasn't it sold? Are there any deal-killer items the seller is aware of (foundation, flood, title, zoning, code violations)?
- Is there a deadline driving the sale (1031 exchange, divorce, estate, relocation)? That informs how much negotiation room exists.
- Schools are F-rated, which usually means shorter tenancies and higher turnover. Who's the typical renter profile here, and what's been the actual vacancy rate?
- Crime grade is F in this area — have there been break-ins, vandalism, or insurance claims at this property in the last 3 years? What carrier currently insures it and at what premium?
Repairs flagged (vision-AI assessment)
- Moderate: Wooden fence — Weathered and discolored
- Minor: Interior walls — Paint appears faded
CashFlowRE · CFR-BDGDEW8CPYG7R2
· Data 1 week ago
cashflowre.app · 2026-05-29