 15-Plex
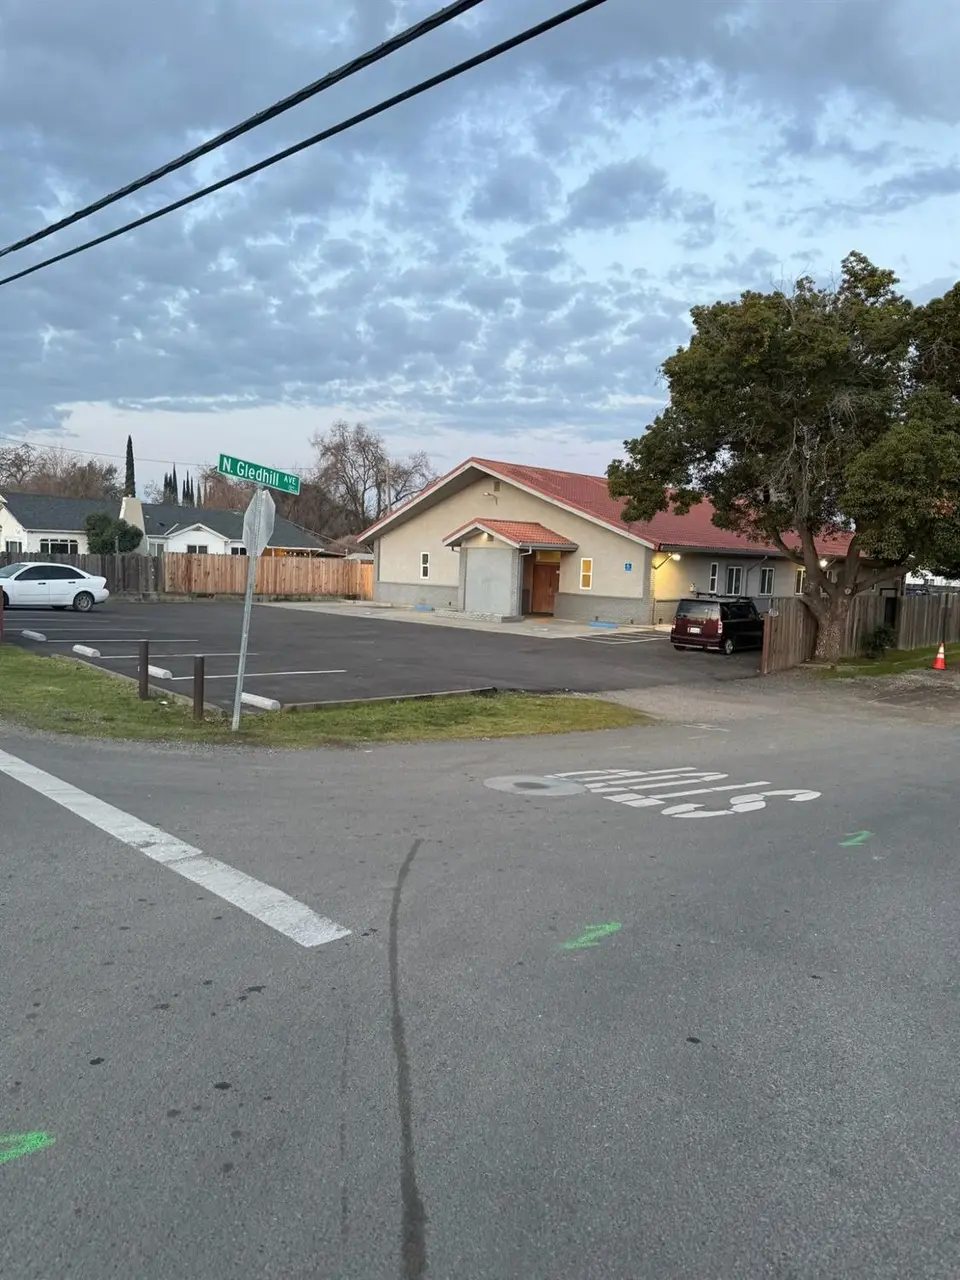
5638 N Gledhill Ave · Linda, CA
Flood risk 6/10 · Moderate
- FEMA flood zone
- X
- Chance of flooding over 30 yrs
- 0.27%
- Est. flood insurance / yr
- $507 – $1,088
Fire risk 8/10 · Major
- Est. fire insurance / yr
- $659 – $1,223
Heat risk 7/10 · Major
- Hot days now (above 105°F)
- 7 days/yr
- Hot days in 30 yrs
- 16 days/yr
Wind risk 1/10 · Minimal
- Chance of severe wind over 30 yrs
- —
Air-quality risk 10/10 · Severe
- Unhealthy air days now
- 26 days/yr
- Unhealthy air days in 30 yrs
- 30 days/yr
Risk factors via First Street. Map © Google.
Why this score? — see what drove the B- grade
The composite is a weighted blend of 9 inputs, each scored 0–100. Each bar is that input's sub-score; the figure is the points it added to the 100-point composite (weight × sub-score).
- Cash flow +30.0/30.0
- 1% rule +10.0/10.0
- DSCR +10.0/10.0
- ARV discount +7.5/15.0
- Livability +2.6/5.0
- Rent growth +2.5/5.0
- Condition / age +2.2/5.0
- Schools +1.8/10.0
- Appreciation +0.0/10.0
$850,000
🖨 Deal sheet 📄 Offer letter ✓ Due diligence
Multi-family units
County records classify this as Multi-Family (5+ Unit). Listing-text estimate: 15 units. confirmed
5+ unit building — per-unit beds/baths from public records are typically unavailable; the breakdown below (if shown) is an estimate from the listing text.
Listing remarks
Investor's Dream, Incredible Value!!!, $414,990.00 Price reduction to, only $850,000.00! Cash perferred + closing costs! Incredible Opportunity to secure a 15 Unit Complex, that is easy on your wallet! FINALED ON 10/29/2024, i. e. , PERMITTED USE CHANGE FROM A CHURCH TO A MULTI-UNIT COMPLEX Note: Subject Property has Fire Suppression and Fire Alarm Central Systems, coupled with 15 on-site individual Parking Spaces, which include two Disability Parking Spaces. THIS OFFERING IS A GREAT NO-BRAINER FINANCIAL OPPORTUNITY! Close to shopping, i. e. , Wal-Mart, Costco, Restaurants, Fast Food Facilities, Service Stations, Hospital, etc. , coupled with easy commutes to Lincoln, Roseville, Sacramento,
Key facts
- Close to shopping
- 0.4 acre lot
- 15 parking spots
Tags
Neighborhood map
What this means for you Summary
Snapshot
- This is a 15 × 1-bed/1-bath units multifamily listed at $850k. Condition is rated fair.
Deal economics
- At list price, monthly cash flow is $10k ($123k/yr) — positive. Per door: $685/mo.
- The deal already cash-flows at list — no discount required.
- Meets the 1% rule at list price ($20k rent vs $850k).
- Recommended offer: $748k (12.0% below list) — sets the bar for market timing.
- Cap rate 20.8% vs local median 2.8% in Linda — top-decile yield for the area; either an underpriced asset or a hidden risk that comps aren't pricing in. Stress-test before assuming the spread holds.
Location & tenants
- Location reads 52/100 on livability (#995 in CA) — a working-class tenant base; expect higher turnover. Strengths: commute A+, housing A+; Watch: schools F, crime F, amenities F.
- Marysville Joint Unified (suburban): math 14% / reading 28% proficiency, ranked #455 of 517 in CA (top 88%) — low school quality limits family demand, transient renter base, plan for 1-2y turnover; 68% free/reduced lunch — lower-income household profile, screen leases tightly.
- Market conditions: 315 active listings in the ZIP; solid renter incomes; 750 units permitted in Yuba County in 2024 (41 in 5+ unit buildings).
- At $20,439/mo this rent would consume 274% of the median local household income ($90k/yr) (locally 461% of renters already pay >50% of income on rent) — very limited rent-growth headroom before tenants either downsize or default.
Forward outlook
- Local home prices are declining (-3.0%/yr); year-one equity from $6k of loan paydown is wiped out by about $26k of value loss. Plan a longer hold.
- Yuba County population projected to shrink 3% by 2050 — rents likely to lag national; underwrite the cash flow, not the appreciation.
- At projected returns (-3.0% appreciation + 3.0% rent growth), your $238k cash investment doubles in ~3 years — after that, you're playing with house money.
Negotiation context
- It's been on market 497 days — a 12% lower offer ($748k) is reasonable based on typical stale-listing flexibility.
Risks & watch-outs
- Climate carrying-cost: major flood risk; severe wildfire risk; extreme-heat days projected 7→16/yr by 2055 (HVAC capex compounding) — expect insurance premiums to compound above CPI over the hold.
Questions for the listing agent
- It's been on market 497 days. Have you received any prior offers? Is the seller open to a 12% concession, seller financing, or rate buy-down credit?
- Can we see the unit-by-unit rent roll, current vacancy, and any below-market leases? What's the average tenancy length?
- What capital expenditures (roof, boiler, parking lot, exteriors) have been made in the last 5 years, and what's planned in the next 2?
- Have any recent inspections been done? Can we get a copy of the seller's disclosures and any deferred-maintenance estimates?
- Why hasn't it sold? Are there any deal-killer items the seller is aware of (foundation, flood, title, zoning, code violations)?
- Is there a deadline driving the sale (1031 exchange, divorce, estate, relocation)? That informs how much negotiation room exists.
- Schools are F-rated, which usually means shorter tenancies and higher turnover. Who's the typical renter profile here, and what's been the actual vacancy rate?
- Crime grade is F in this area — have there been break-ins, vandalism, or insurance claims at this property in the last 3 years? What carrier currently insures it and at what premium?
- What's the average days-on-market for RENTAL listings here right now (not sales)? A rising rental-DOM trend means longer vacancies and softer asking-rent achievability than the comps imply.
- What's the recent tenant-quality profile in this submarket — average credit score on applications, eviction rate, late-payment / NSF rate, and stable-employment percentage? A property-management company in the area should have these aggregated.
- How much new apartment / multifamily construction is in the pipeline within 1–3 miles? Heavy new supply (>2% of stock underway) typically softens rents 12–24 months out; light construction supports rent growth.
Investment metrics
- 1% rule
- 2.40% ✓
- Cap rate
- 20.80%
- Cash-on-cash
- 51.79%
- DSCR
- 3.30
- GRM
- 3.5
CMA / ARV
- ARV (median comp)
- $521,968
- List price
- $850,000
- Delta
- 62.85%
- Verdict
- OVERPRICED
- Comps
- 3 within 2.0 mi
Projected returns pro-forma
-3.0% appreciation · 3.0% rent growth · sell at horizon
- IRR
- 49.7%
- Equity multiple
- 3.17×
- Total profit
- $516,842
- Equity at exit
- $126,738
- IRR
- 55.2%
- Equity multiple
- 6.44×
- Total profit
- $1,293,788
- Equity at exit
- $73,492
Cash invested: $238,000 (down + closing). Projections, not guarantees.
Landlord ↔ Tenant lean methodology
- Overall (STATE)
- 18 Strongly Tenant-Friendly
- State California
- 18 Strongly Tenant-Friendly · D+13
- County
- — inherits STATE
- City
- — inherits STATE
ZIP-level market 95961
- Home prices YoY
- -28.2%
- Active inventory
- 315
- Price-to-rent
- 52.0×
Monthly cashflow live
- Estimated rent
- $20,439 medium interval (Pro) →
- Mortgage (P&I)
- −$4,457
- Tax est. 1.5%
- −$1,062 /mo · $12,750/yr
- Insurance
- −$354
- HOA
- −$0
- Vacancy / Maint / Mgmt
- −$4,292
- Net cashflow
- $10,273
Break-even live
15-unit breakdown (identical units grouped — click to expand)
| Units | Beds | Baths | Est. rent |
|---|---|---|---|
| 15× units | 1 | 1 | $20,445 |
| #1 | 1 | 1 | $1,363 |
| #2 | 1 | 1 | $1,363 |
| #3 | 1 | 1 | $1,363 |
| #4 | 1 | 1 | $1,363 |
| #5 | 1 | 1 | $1,363 |
| #6 | 1 | 1 | $1,363 |
| #7 | 1 | 1 | $1,363 |
| #8 | 1 | 1 | $1,363 |
| #9 | 1 | 1 | $1,363 |
| #10 | 1 | 1 | $1,363 |
| #11 | 1 | 1 | $1,363 |
| #12 | 1 | 1 | $1,363 |
| #13 | 1 | 1 | $1,363 |
| #14 | 1 | 1 | $1,363 |
| #15 | 1 | 1 | $1,363 |
| Total (15 units) | $20,439 | ||
UW: 25.0% down · 7.5% · 30yr · 1.5% tax · 5.0% vac · 8.0% maint · 8.0% mgmt
Financing live
Cash to close
- Down payment
- $212,500
- Closing costs
- $25,500
- Reserves months
- —
- Total cash needed
- —
Loan-product check · same deal, 3 products live
Conventional
25% down · 7.5% · 30yr
- Down + closing
- —
- Monthly P&I
- —
- Monthly cashflow
- —
- DSCR
- —
- Eligible?
- —
Personal DTI + credit; lowest rate.
DSCR
20% down · 8.5% · 30yr
- Down + closing
- —
- Monthly P&I
- —
- Monthly cashflow
- —
- DSCR
- —
- Eligible?
- —
No personal income docs; deal must DSCR.
Hard money
10% down · 12.0% · 12mo
- Down + closing
- —
- Monthly P&I
- —
- Monthly cashflow
- —
- DSCR
- —
- Eligible?
- —
Short-term bridge; refi at stabilization.
Listing history 10 events
-
2026-06-10days on market $850,000 Active 497 DOM
-
2026-06-09days on market $850,000 Active 496 DOM
-
2026-06-08days on market $850,000 Active 495 DOM
-
2026-06-07days on market $850,000 Active 494 DOM
-
2026-06-05days on market $850,000 Active 491 DOM
-
2026-06-03days on market $850,000 Active 490 DOM
-
2026-06-02days on market $850,000 Active 489 DOM
-
2026-06-01days on market $850,000 Active 488 DOM
-
2026-05-31days on market $850,000 Active 487 DOM
-
2026-05-30days on market $850,000 Active 486 DOM
ⓘ Source: listings_history table (triggers on properties + properties_extension) + one-shot
backfill from property_details.listing_events for pre-trigger history.
Climate risk First Street
- Flood 6/10 Major FEMA zone X · 27% chance over 30 yrs
- Wildfire 8/10 Severe
- Heat 7/10 Severe 7 d/yr ≥105°F today · 16 d/yr by 30 yrs out
- Wind 1/10 Low
- Air quality 10/10 Extreme 26 unhealthy d/yr today · 30 by 30 yrs out
Nearby sold comps map
Loading sold comps map…
Walkable amenities ~0.75 mi
Loading nearby amenities…
Taxation est. · year 1
- Rental income
- $245,268
- − Mortgage interest
- −$47,613
- − Property taxes
- −$12,750
- − Insurance
- −$4,250
- − Repairs & maintenance
- −$19,621
- − Management
- −$19,621
- − Depreciation
- −$24,727
- Taxable income
- $116,685
- Est. tax owed @ 24.0%
- −$28,004
- After-tax cash flow
- $95,267/yr
For passive investors: Depreciation is non-cash, so a rental often shows a tax loss while cash-flowing — sheltering income. Rental losses are passive: they offset passive income freely, and up to $25,000/yr can offset ordinary (W-2) income if you actively participate and your MAGI is under $100k (phasing out to $0 by $150k); unused losses carry forward. On sale, claimed depreciation is recaptured at up to 25%, and gains may owe capital-gains tax (a 1031 exchange can defer both). Figures are a year-1 estimate at your 24.0% rate — not tax advice; consult a CPA.
Condition & rehab AI · 13 photos
The property shows moderate wear and requires some repairs and maintenance to improve its condition and value.
Repairs flagged
- Moderate Wooden fence — Weathered and discolored
- Minor Interior walls — Paint appears faded
Value-add opportunities
- Both Paint interior walls — Fresh paint enhances curb appeal and interior aesthetics
- Both Replace wooden fence — A new fence would improve curb appeal and property value
Renovation cost estimate screening
| Repair item | Severity | Est. cost |
|---|---|---|
| Wooden fence · Weathered and discolored | Moderate | $3,000–15,000 |
| Interior walls · Paint appears faded | Minor | $500–3,000 |
| Total estimated repair cost · 2 items | $3,500–18,000 |
Value-add ROI direction
- Both Paint interior walls — Fresh paint enhances curb appeal and interior aesthetics ↑
- Both Replace wooden fence — A new fence would improve curb appeal and property value ↑
ⓘ Cost ranges are severity-bucket heuristics (US national rule-of-thumb). Get contractor quotes + a written scope before underwriting a rehab budget.
Schools (NCES district)
- District
- Marysville Joint Unified
- NCES district ID
- 0624090
- Math proficiency
- 14% ▼ -13.00%
- Reading proficiency
- 28% ▼ -10.00%
- Median HH income
- $44,598
- Composite
- 18.18/100
- National rank
- #8961
- State rank
- #455 of 517 in CA
Livability — Linda
- Score
- 52/100
- State rank
- #995
- US rank
- #24769
Category grades
Schools grade is shown separately in the Schools card above.
Census & demographics
- Census place
- Linda, CA
- County
- Yuba County · 71,731 people
- Metro
- Yuba City, CA
- Population (ZIP)
- 33,999
- Household income
- $89,561
- Rent vs Own
- Severe rent burden
- 461.0
Population outlook (Yuba County) Hauer SSP2
- Today (2025)
- 75,432 people
- By 2030
- 75,358 · -0.1%
- By 2040
- 74,643 · -1.0%
- By 2050
- 72,937 · -3.3%
- By 2075
- 66,368 · -12.0%
- By 2100
- 54,524 · -27.7%
Race, ethnicity, and origin ACS 2023
- Neighborhood character
- Diverse neighborhood (Simpson 0.67)
- Race & ethnicity
- White 42% Hispanic / Latino 39% Two or more races 18% Asian 8% Black 4% Native American 1%
- Hispanic origin (detail)
- Mexican 32% Puerto Rican 2%
- Common ancestry
- Lithuanian 1% Slovak 1% Italian 1%
- Foreign-born
- 12% · Canada
- Languages at home
- 69% English-only · Spanish 23% Other Asian/Pacific 5% Russian/Polish/Slavic 1%
Political lean MEDSL · Yuba
- 2024 margin
- Strong R (+25.8) · D 35.7% · R 61.5% · Other 2.8%
- 2008→2024 swing
- -11.2pp toward R · 2008: -14.7pp · 2024: -25.8pp
- All cycles
- 2024: R+25.8 2020: R+21.6 2016: R+24.1 2012: R+19.5 2008: R+14.7
Not yet ingested
- Civics
- —
Market trends
- HPI YoY
- ▼ -87.37%
- Current HPI
- 222.3191
- Rent YoY
- —
- Metro
- Yuba City, CA
- State GDP YoY
- ▲ 3.21%
- F500 in state
- 116
Industry mix (Fortune 500 HQ in CA)
| Industry | F500 HQs | Revenue |
|---|---|---|
| Technology | 27 | $1,492B |
|
||
| Financial Services | 3 | $174B |
|
||
| Retail | 3 | $44B |
|
||
| Insurance | 3 | $26B |
|
||
| Media / Entertainment | 2 | $115B |
|
||
| Pharmaceuticals / Biotech | 2 | $62B |
|
||
Cash-flow waterfall
monthlySold comps — $/sqft
last 12 mo · ≤1 miLoading sold comps…