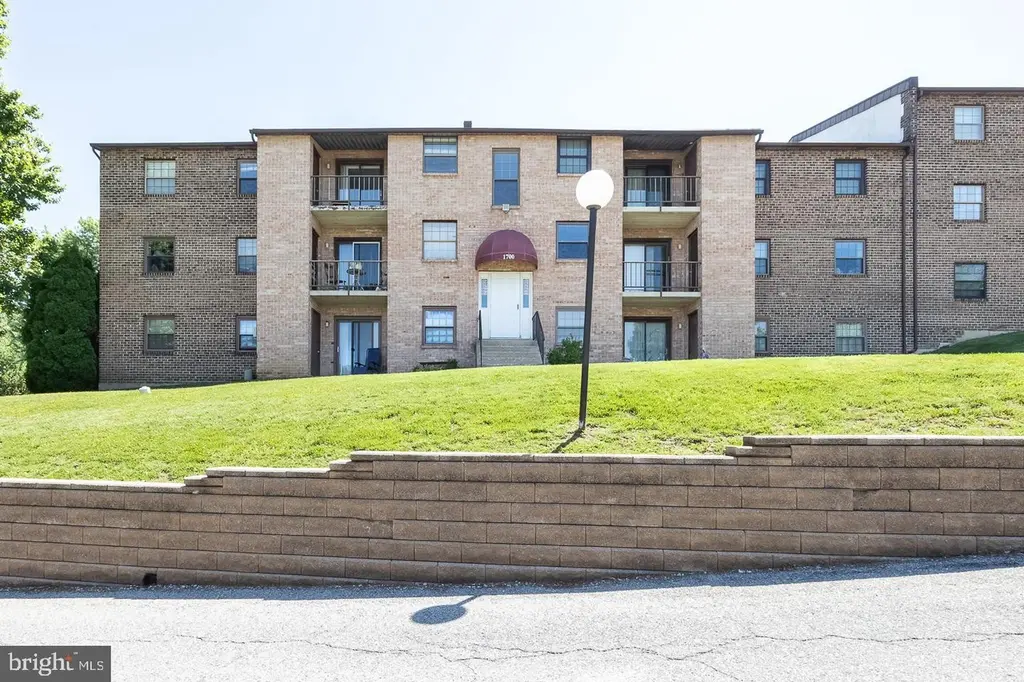
1709 Valley Dr #1709
Cheyney University, PA 19382
$209,900D-
2 bd · 1.0 ba ·
900 sqft ·
Built 1984
· Condo
· Pending
· 6 DOM
Cashflow @ list (25.0% down · 7.5%)
Estimated rent
$1,915/mo
Mortgage (P&I)
−$1,101
Tax + insurance
−$226
HOA
−$292
Vac / Maint / Mgmt
−$402
Net cashflow
$-106/mo
Annual
$-1,272/yr
Cap rate
5.69%
Cash-on-cash
-2.16%
DSCR
0.90
1% rule
0.91%
Cash to close
$58,772
Investor read
- This is a 2-bed/1.0-bath condo listed at $210k.
- At list price, monthly cash flow is $-106 ($-1k/yr) — negative.
- To cash-flow at today's rent, offer at most $191k (8.9% below list).
- To meet the 1% rule (rent ≥ 1% of price), the offer needs to be $192k (8.8% below list).
- Only 6 days on market — expect competitive offers; lowballing is unlikely to land.
- Recommended offer: $191k (8.9% below list) — sets the bar for cash-flow.
- Local home prices are declining (-3.0%/yr); year-one equity from $1k of loan paydown is wiped out by about $6k of value loss. Plan a longer hold.
- Location reads 49/100 on livability (#1,706 in PA) — a working-class tenant base; expect higher turnover. Strengths: cost of living A+, crime A; Watch: amenities F, commute F, employment F.
- West Chester Area SD (suburban): math 56% / reading 74% proficiency, ranked #34 of 539 in PA (top 6%) — acceptable for families but not a draw, mixed tenant base, ~2y average lease; only 11% free/reduced lunch — higher-income household profile.
- Zoned schools: Glen Acres El Sch (math 62% / reading 72%, grade B+, #202 of 1,518 statewide, top 15%, 485 students, 24% FRL); J R Fugett Ms (math 40% / reading 75%, grade B, #61 of 512 statewide, top 13%, 908 students, 23% FRL); West Chester East Hs (math 86%, 1,251 students, 20% FRL).
- Market conditions: Rents rising fast (+4.8%/yr); 215 active listings in the ZIP; 15 comparable units currently listed for rent nearby; rentals at typical pace (median 17d on market — plan ~3-4 weeks tenant-placement turnaround); high-income renter base; 1,513 units permitted in Chester County in 2024 (354 in 5+ unit buildings).
- Chester County population projected at +6% by 2050 — modest demand growth; plan on rents tracking national, not racing it.
- 5 sale attempts since 32y ago with the ask held roughly flat each time — persistent listings suggest the price (not the market) is what's stuck; bring a comps-based counter.
- Current owner paid $56k; list at $210k implies a 272% gain — meaningful room to come down on a strong offer.
- Climate carrying-cost: major wind risk, 27% chance of damaging wind over 30y; extreme-heat days projected 7→14/yr by 2055 (HVAC capex compounding) — expect insurance premiums to compound above CPI over the hold.
- Cap rate 5.7% vs local median 1.8% in Cheyney University — top-decile yield for the area; either an underpriced asset or a hidden risk that comps aren't pricing in. Stress-test before assuming the spread holds.
- This rent is only 17% of the median local income ($132k/yr) — well below the 30% rent-burden line; pricing power to push rent on renewal without tenant pushback.
Questions for listing agent
- What do current leases actually rent for vs. the listed asking? Can we see a recent rent roll and the last 12 months of T-12 income?
- What does the HOA fee cover, when was the last increase, and are there any pending special assessments or reserve-fund shortfalls?
- Any open or pending special assessments — roof, HVAC, plumbing, elevator, façade? What's the per-unit balance and payoff schedule, and is the seller paying it off at close or rolling it to the buyer?
- Is there a deadline driving the sale (1031 exchange, divorce, estate, relocation)? That informs how much negotiation room exists.
- The area grade is low — what's the realistic commute time and amenity access for the typical tenant pool here? Any planned neighborhood developments (good or bad) we should know about?
- What's the average days-on-market for RENTAL listings here right now (not sales)? A rising rental-DOM trend means longer vacancies and softer asking-rent achievability than the comps imply.
- What's the recent tenant-quality profile in this submarket — average credit score on applications, eviction rate, late-payment / NSF rate, and stable-employment percentage? A property-management company in the area should have these aggregated.
- How much new apartment / multifamily construction is in the pipeline within 1–3 miles? Heavy new supply (>2% of stock underway) typically softens rents 12–24 months out; light construction supports rent growth.
CashFlowRE · CFR-BE5K9H40SQPF1T
· Data 1 week ago
cashflowre.app · 2026-05-29