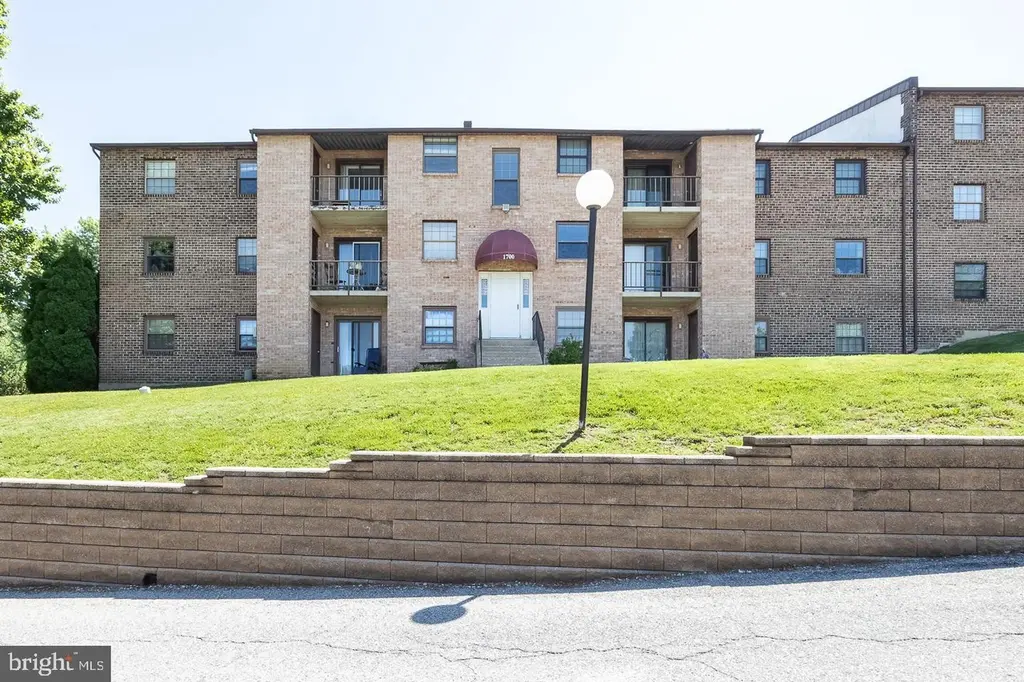
1709 Valley Dr #1709 · Cheyney University, PA
Flood risk 3/10 · Minor
- FEMA flood zone
- X (unshaded)
- Chance of flooding over 30 yrs
- 0.12%
- Est. flood insurance / yr
- $507 – $1,088
Fire risk 1/10 · Minimal
- Est. fire insurance / yr
- $511 – $949
Heat risk 6/10 · Moderate
- Hot days now (above 101°F)
- 7 days/yr
- Hot days in 30 yrs
- 14 days/yr
Wind risk 6/10 · Moderate
- Chance of severe wind over 30 yrs
- 27.0%
Air-quality risk 3/10 · Minor
- Unhealthy air days now
- 2 days/yr
- Unhealthy air days in 30 yrs
- 5 days/yr
Risk factors via First Street. Map © Google.
Why this score? — see what drove the D- grade
The composite is a weighted blend of 9 inputs, each scored 0–100. Each bar is that input's sub-score; the figure is the points it added to the 100-point composite (weight × sub-score).
- Cash flow +10.5/30.0
- ARV discount +7.5/15.0
- Schools +5.9/10.0
- 1% rule +4.1/10.0
- Rent growth +3.7/5.0
- DSCR +3.0/10.0
- Livability +2.5/5.0
- Condition / age +2.5/5.0
- Appreciation +0.0/10.0
$209,900
🖨 Deal sheet (PDF) 📄 Offer letter ✓ Due diligence
Listing remarks MLS
2Nd Floor Gv Flat, Neutral Colors, Fireplace, Parquet Floors, Custom Bathroom, Wall Washer & Dryer, Pool & Tennis Included, Nice, Warm & Comfortable, Why Pay Rent????
Key facts
- Brick accent wall
- Galley-style kitchen
- Private balcony
Tags
Property features AI
Finance
- Other: Ground rent paid annually
- HOA & community: Monthly condo fee of $292; Condo fee covers sewer, trash and snow removal; Community amenities include clubhouse, swimming pool, tennis courts and playgrounds; Pets allowed (cats and dogs)
Exterior
- Parking: Parking lot; Guest parking available throughout the community
- Utilities: Public water; Public sewer; Electric service for heating, cooling and hot water
- Home design: Garden-style building (1–4 floors); Unit/flat; Entry level: 1; Municipality: East Goshen Township
- Construction: Brick construction; Above-grade and below-grade structures noted
- Exterior features: Condominium ownership; Not in a federal flood zone; No basement; Finished above-grade area (900)
Interior
- Bedrooms: Two bedrooms on the main level
- Bathrooms: One full bathroom on the main level; One full bathroom total
- Heating & cooling: Heat pump(s) heating; Central air conditioning; Electric heating and cooling; Electric hot water
- Interior features: Not furnished; Lower-level unit (entry floor 1)
- Laundry & utility: Washer/dryer hookup in unit
Neighborhood map
What this means for you Summary
Snapshot
- This is a 2-bed/1.0-bath condo listed at $210k.
Deal economics
- At list price, monthly cash flow is $-106 ($-1k/yr) — negative.
- To cash-flow at today's rent, offer at most $191k (8.9% below list).
- To meet the 1% rule (rent ≥ 1% of price), the offer needs to be $192k (8.8% below list).
- Recommended offer: $191k (8.9% below list) — sets the bar for cash-flow.
- Cap rate 5.7% vs local median 1.8% in Cheyney University — top-decile yield for the area; either an underpriced asset or a hidden risk that comps aren't pricing in. Stress-test before assuming the spread holds.
Location & tenants
- Location reads 49/100 on livability (#1,706 in PA) — a working-class tenant base; expect higher turnover. Strengths: cost of living A+, crime A; Watch: amenities F, commute F, employment F.
- West Chester Area SD (suburban): math 56% / reading 74% proficiency, ranked #34 of 539 in PA (top 6%) — acceptable for families but not a draw, mixed tenant base, ~2y average lease; only 11% free/reduced lunch — higher-income household profile.
- Zoned schools: Glen Acres El Sch (math 62% / reading 72%, grade B+, #202 of 1,518 statewide, top 15%, 485 students, 24% FRL); J R Fugett Ms (math 40% / reading 75%, grade B, #61 of 512 statewide, top 13%, 908 students, 23% FRL); West Chester East Hs (math 86%, 1,251 students, 20% FRL).
- Market conditions: Rents rising fast (+4.8%/yr); 215 active listings in the ZIP; 15 comparable units currently listed for rent nearby; rentals at typical pace (median 17d on market — plan ~3-4 weeks tenant-placement turnaround); high-income renter base; 1,513 units permitted in Chester County in 2024 (354 in 5+ unit buildings).
- This rent is only 17% of the median local income ($132k/yr) — well below the 30% rent-burden line; pricing power to push rent on renewal without tenant pushback.
Forward outlook
- Local home prices are declining (-3.0%/yr); year-one equity from $1k of loan paydown is wiped out by about $6k of value loss. Plan a longer hold.
- Chester County population projected at +6% by 2050 — modest demand growth; plan on rents tracking national, not racing it.
Negotiation context
- Only 6 days on market — expect competitive offers; lowballing is unlikely to land.
- 5 sale attempts since 32y ago with the ask held roughly flat each time — persistent listings suggest the price (not the market) is what's stuck; bring a comps-based counter.
- Current owner paid $56k; list at $210k implies a 272% gain — meaningful room to come down on a strong offer.
Risks & watch-outs
- Climate carrying-cost: major wind risk, 27% chance of damaging wind over 30y; extreme-heat days projected 7→14/yr by 2055 (HVAC capex compounding) — expect insurance premiums to compound above CPI over the hold.
Questions for the listing agent
- What do current leases actually rent for vs. the listed asking? Can we see a recent rent roll and the last 12 months of T-12 income?
- What does the HOA fee cover, when was the last increase, and are there any pending special assessments or reserve-fund shortfalls?
- Any open or pending special assessments — roof, HVAC, plumbing, elevator, façade? What's the per-unit balance and payoff schedule, and is the seller paying it off at close or rolling it to the buyer?
- Is there a deadline driving the sale (1031 exchange, divorce, estate, relocation)? That informs how much negotiation room exists.
- The area grade is low — what's the realistic commute time and amenity access for the typical tenant pool here? Any planned neighborhood developments (good or bad) we should know about?
- What's the average days-on-market for RENTAL listings here right now (not sales)? A rising rental-DOM trend means longer vacancies and softer asking-rent achievability than the comps imply.
- What's the recent tenant-quality profile in this submarket — average credit score on applications, eviction rate, late-payment / NSF rate, and stable-employment percentage? A property-management company in the area should have these aggregated.
- How much new apartment / multifamily construction is in the pipeline within 1–3 miles? Heavy new supply (>2% of stock underway) typically softens rents 12–24 months out; light construction supports rent growth.
Investment metrics
- 1% rule
- 0.91% ✗
- Cap rate
- 5.69%
- Cash-on-cash
- -2.16%
- DSCR
- 0.90
- GRM
- 9.1
CMA / ARV
No comps found within radius.
Projected returns pro-forma
-3.0% appreciation · 4.79% rent growth · sell at horizon
- IRR
- -17.6%
- Equity multiple
- 0.37×
- Total profit
- $-37,122
- Equity at exit
- $31,297
- IRR
- -6.2%
- Equity multiple
- 0.57×
- Total profit
- $-25,539
- Equity at exit
- $18,148
Cash invested: $58,772 (down + closing). Projections, not guarantees.
Landlord ↔ Tenant lean methodology
- Overall (STATE)
- 62 Landlord-Friendly
- State Pennsylvania
- 62 Landlord-Friendly · EVEN
- County
- — inherits STATE
- City
- — inherits STATE
ZIP-level market 19382
- Rents YoY
- 4.8%
- Active inventory
- 215
- Price-to-rent
- 9.1×
Monthly cashflow live
- Estimated rent
- $1,915 high interval (Pro) →
- Mortgage (P&I)
- −$1,101
- Tax from tax record
- −$139 /mo · $1,665/yr
- Insurance
- −$87
- HOA
- −$292
- Vacancy / Maint / Mgmt
- −$402
- Net cashflow
- $-106
Break-even live
Sensitivity live
| Price | -10% $13 | -5% $-47 | +0% $-106 | +5% $-165 | +10% $-225 |
|---|---|---|---|---|---|
| Rent | -10% $-257 | -5% $-182 | +0% $-106 | +5% $-30 | +10% $45 |
| Rate | -1.0pp $0 | -0.5pp $-53 | base $-106 | +0.5pp $-160 | +1.0pp $-216 |
UW: 25.0% down · 7.5% · 30yr · 1.5% tax · 5.0% vac · 8.0% maint · 8.0% mgmt
Financing live
Cash to close
- Down payment
- $52,475
- Closing costs
- $6,297
- Reserves months
- —
- Total cash needed
- —
Loan-product check · same deal, 3 products live
Conventional
25% down · 7.5% · 30yr
- Down + closing
- —
- Monthly P&I
- —
- Monthly cashflow
- —
- DSCR
- —
- Eligible?
- —
Personal DTI + credit; lowest rate.
DSCR
20% down · 8.5% · 30yr
- Down + closing
- —
- Monthly P&I
- —
- Monthly cashflow
- —
- DSCR
- —
- Eligible?
- —
No personal income docs; deal must DSCR.
Hard money
10% down · 12.0% · 12mo
- Down + closing
- —
- Monthly P&I
- —
- Monthly cashflow
- —
- DSCR
- —
- Eligible?
- —
Short-term bridge; refi at stabilization.
Rent comps 15 comps
| Address | Beds | Baths | Sqft | Rent | $/sqft | DOM | Units | Dist |
|---|---|---|---|---|---|---|---|---|
| 1906 Valley Dr Unit 1906 West Chester, PA | 2.0 | 1.0 | 900 | $1,699 | $1.89 | 26d | 1 | 0.01mi |
| 1906 Valley Dr Unit 1979 West Chester, PA | 2.0 | 1.0 | 900 | $1,799 | $2.00 | 20d | 1 | 0.01mi |
| 2319 Pond View Dr West Chester, PA | 2.0 | 1.0 | 945 | $1,899 | $2.01 | 26d | 1 | 0.03mi |
| 2402 Pond View Dr Unit 2402 West Chester, PA | 2.0 | 1.0 | 945 | $1,795 | $1.90 | 16d | 1 | 0.06mi |
| 803 Valley Dr West Chester, PA | 2.0 | 1.5 | 1066 | $1,995 | $1.87 | 21d | 1 | 0.12mi |
| 2916 Eagle Rd Unit 2916 West Chester, PA | 2.0 | 1.0 | 945 | $1,675 | $1.77 | 16d | 1 | 0.13mi |
| 3218 Valley Dr West Chester, PA | 2.0 | 1.0 | 945 | $1,795 | $1.90 | 45d | 1 | 0.22mi |
| 1308 W Chester Pike West Chester, PA | 1.0–2.0 | 1.0 | 698 | $1,895 | $2.71 | 14d | 10 | 0.38mi |
| 1323 W Chester Pike West Chester, PA | 1.0–2.0 | 1.0–2.0 | 885 | $2,440 | $2.76 | 0d | 1 | 0.38mi |
| 2 Waterview Rd West Chester, PA | 2.0 | 1.0–1.5 | 575 | $1,990 | $3.46 | 0d | 14 | 0.55mi |
| 547 Summit House Unit 547 West Chester, PA | 3.0 | 1.5 | 1100 | $2,350 | $2.14 | 16d | 1 | 0.85mi |
| 1149 Kingsway Rd West Chester, PA | 1.0–2.0 | 1.0 | 830 | $1,980 | $2.39 | 0d | 9 | 1.23mi |
| 1515 Manley Rd West Chester, PA | 1.0–2.0 | 1.0–2.0 | 1102 | $2,509 | $2.28 | 21d | 9 | 1.26mi |
| 1100 W Chester Pike West Chester, PA | 1.0–3.0 | 1.0–2.0 | 892 | $2,000 | $2.24 | 11d | 1 | 1.31mi |
| 1500 Windermere Rd West Chester, PA | 1.0–2.0 | 1.0–2.0 | 931 | $2,330 | $2.50 | 0d | 10 | 1.40mi |
HOA detail condo
- Monthly dues
- $292 · $3,504/yr
- Likely covers
- pool
- Assessments
- None detected in remarks — confirm with the listing agent.
Listing history 5 events
-
2026-06-13statusdays on market $209,900 Pending 6 DOM
-
2026-06-09days on market $209,900 Active 4 DOM
-
2026-06-08days on market $209,900 Active 3 DOM
-
2026-06-07remarks 699-char remark
-
2026-06-07$209,900 Active 2 DOM
ⓘ Source: listings_history table (triggers on properties + properties_extension) + one-shot
backfill from property_details.listing_events for pre-trigger history.
Tax reassessment forecast PA · Partial reset (capped growth)
- Current annual tax
- $1,665 · $139/mo
- Projected year-2 tax
- $2,491 · $208/mo
- Expected delta
- +$826/yr (+$69/mo · 49.6%)
ⓘ Screening estimate from a state-policy table — verify with the county assessor before closing.
Climate risk First Street
- Flood 3/10 Moderate FEMA zone X (unshaded) · 12% chance over 30 yrs
- Wildfire 1/10 Low
- Heat 6/10 Major 7 d/yr ≥101°F today · 14 d/yr by 30 yrs out
- Wind 6/10 Major 27% chance of damaging wind over 30 yrs
- Air quality 3/10 Moderate 2 unhealthy d/yr today · 5 by 30 yrs out
Nearby sold comps map
Loading sold comps map…
Walkable amenities ~0.75 mi
Loading nearby amenities…
Taxation est. · year 1
- Rental income
- $22,981
- − Mortgage interest
- −$11,758
- − Property taxes
- −$1,665
- − Insurance
- −$1,050
- − Repairs & maintenance
- −$1,838
- − Management
- −$1,838
- − HOA
- −$3,504
- − Depreciation
- −$6,106
- Taxable loss
- −$4,778
- Est. tax savings @ 24.0%
- +$1,147
- After-tax cash flow
- $-125/yr
For passive investors: Depreciation is non-cash, so a rental often shows a tax loss while cash-flowing — sheltering income. Rental losses are passive: they offset passive income freely, and up to $25,000/yr can offset ordinary (W-2) income if you actively participate and your MAGI is under $100k (phasing out to $0 by $150k); unused losses carry forward. On sale, claimed depreciation is recaptured at up to 25%, and gains may owe capital-gains tax (a 1031 exchange can defer both). Figures are a year-1 estimate at your 24.0% rate — not tax advice; consult a CPA.
Schools (NCES district)
- District
- West Chester Area SD
- NCES district ID
- 4225290
- Math proficiency
- 56% ▼ -8.00%
- Reading proficiency
- 74% ▼ -6.00%
- Median HH income
- $87,125
- Composite
- 58.7/100
- National rank
- #980
- State rank
- #34 of 539 in PA
Livability — Cheyney University
- Score
- 49/100
- State rank
- #1706
- US rank
- #25761
Category grades
Schools grade is shown separately in the Schools card above.
Census & demographics
- County
- Chester County · 432,350 people
- Metro
- Philadelphia-Camden-Wilmington, PA-NJ-DE-MD
- Population (ZIP)
- 54,127
- Household income
- $132,091
- Rent vs Own
- Severe rent burden
- 1770.0
Population outlook (Chester County) Hauer SSP2
- Today (2025)
- 546,756 people
- By 2030
- 559,441 · +2.3%
- By 2040
- 576,377 · +5.4%
- By 2050
- 580,602 · +6.2%
- By 2075
- 581,575 · +6.4%
- By 2100
- 540,922 · -1.1%
Race, ethnicity, and origin ACS 2023
- Neighborhood character
- Predominantly White (82%)
- Race & ethnicity
- White 82% Black 6% Asian 5% Two or more races 5% Hispanic / Latino 4%
- Common ancestry
- Romanian 5% Slovak 2% Lithuanian 2%
- Foreign-born
- 8% · Canada, China
- Languages at home
- 92% English-only · Spanish 2% Other Indo-European 2% Chinese 1%
Political lean MEDSL · Chester
- 2024 margin
- D (+14.5) · D 56.7% · R 42.2% · Other 1.0%
- 2008→2024 swing
- +5.2pp toward D · 2008: 9.2pp · 2024: 14.5pp
- All cycles
- 2024: D+14.5 2020: D+17.0 2016: D+9.2 2012: R+0.4 2008: D+9.2
Not yet ingested
- Civics
- —
Market trends
- HPI YoY
- ▼ -251.24%
- Current HPI
- 294.9284
- Rent YoY
- ▲ 4.79%
- Metro
- Philadelphia-Camden-Wilmington, PA-NJ-DE-MD
- State GDP YoY
- ▲ 1.68%
- F500 in state
- 34
Industry mix (Fortune 500 HQ in PA)
| Industry | F500 HQs | Revenue |
|---|---|---|
| Healthcare | 2 | $309B |
|
||
| Insurance | 2 | $27B |
|
||
| Telecommunications / Media | 1 | $124B |
|
||
| Industrial Distribution | 1 | $22B |
|
||
| Financial Services | 1 | $20B |
|
||
| Chemicals / Materials | 1 | $18B |
|
||
Price history
-16.7% since first listed16 events — show timeline
- 2026-06-05 Listed $209,900 BRIGHT MLS
- 2018-05-01 Listing Removed — BRIGHT MLS
- 2018-02-05 Listed $140,900 BRIGHT MLS
- 2000-08-21 Sold (Public Records) $56,500 Public Records
- 2000-07-27 Sold (MLS) $56,500 BRIGHT MLS
- 2000-05-25 Listing Removed — BRIGHT MLS
- 2000-03-18 Listed $56,500 BRIGHT MLS
- 1999-08-28 Listing Removed — BRIGHT MLS
- 1999-02-28 Listed $56,500 BRIGHT MLS
- 1994-09-02 Sold (Public Records) $46,500 Public Records
- 1994-08-31 Sold (MLS) $46,500 BRIGHT MLS
- 1994-08-07 Listing Removed — BRIGHT MLS
- 1994-01-21 Listed $46,500 BRIGHT MLS
- 1986-05-01 Sold (Public Records) $46,500 Public Records
- 1980-03-01 Sold (Public Records) $34,490 Public Records
- 1979-07-01 Sold (Public Records) $252,000 Public Records
Property tax history
+1.7%/yrLatest (2026): $1,665 · +2.2% YoY. Source: county tax records.
Cash-flow waterfall
monthlySold comps — $/sqft
last 12 mo · ≤1 miLoading sold comps…