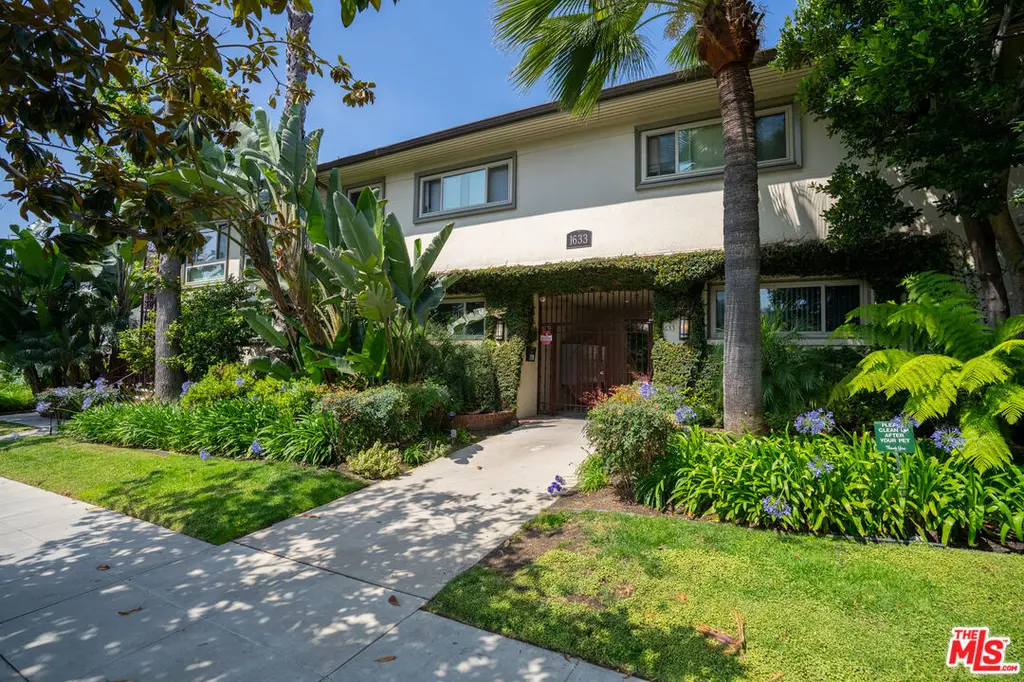
1633 N Laurel Ave
Los Angeles, CA 90046
$9,650,000F
42 bd · 32.0 ba ·
29,283 sqft ·
Built 1953
· MultiFamily
· Active
· 37 DOM
Cashflow @ list (25.0% down · 7.5%)
Estimated rent
$13,252/mo
Mortgage (P&I)
−$50,606
Tax + insurance
−$6,724
HOA
−$0
Vac / Maint / Mgmt
−$2,783
Net cashflow
$-46,861/mo
Annual
$-562,333/yr
Cap rate
0.47%
Cash-on-cash
-20.78%
DSCR
0.08
1% rule
0.14%
Cash to close
$2,702,000
Investor read
- This is a 3 × 14-bed/?-bath units multifamily listed at $9.65M.
- At list price, monthly cash flow is $-47k ($-562k/yr) — negative. Per door: $-16k/mo.
- To cash-flow at today's rent, offer at most $1.37M (85.8% below list).
- To meet the 1% rule (rent ≥ 1% of price), the offer needs to be $1.33M (86.3% below list).
- It's been on market 37 days — a 3% lower offer ($9.36M) is reasonable based on typical stale-listing flexibility.
- Recommended offer: $1.33M (86.3% below list) — sets the bar for 1% rule.
- Local home prices are declining (-3.0%/yr); year-one equity from $67k of loan paydown is wiped out by about $290k of value loss. Plan a longer hold.
- Location reads 68/100 on livability (#273 in CA) — a middle-class / working-renter tenant base. Strengths: amenities A+, commute A+, employment B; Watch: health & safety C-, schools D+, crime F.
- Los Angeles Unified (urban): math 29% / reading 54% proficiency, ranked #223 of 517 in CA (top 43%) — families likely to look elsewhere, expect single-tenant / working-renter base with shorter leases; 67% free/reduced lunch — lower-income household profile, screen leases tightly.
- Watch-outs: flood insurance adds $66/mo; built in 1953 — expect roof / HVAC / electrical / plumbing capex.
- Market conditions: Rents soft (-1.5%/yr); 334 active listings in the ZIP; solid renter incomes; 19,697 units permitted in Los Angeles County in 2024 (9,426 in 5+ unit buildings).
- Los Angeles County population projected at +9% by 2050 — modest demand growth; plan on rents tracking national, not racing it.
- 2 sale attempts since 2y ago with the ask held roughly flat each time — persistent listings suggest the price (not the market) is what's stuck; bring a comps-based counter.
- Climate carrying-cost: major flood risk; extreme-heat days projected 7→22/yr by 2055 (HVAC capex compounding) — expect insurance premiums to compound above CPI over the hold.
- Cap rate 0.5% vs local median 2.1% in Los Angeles — below-typical yield; the buyer is paying a premium for something (appreciation thesis, condition, location) that the cap rate doesn't capture.
- At $13,252/mo this rent would consume 165% of the median local household income ($96k/yr) (locally 5563% of renters already pay >50% of income on rent) — very limited rent-growth headroom before tenants either downsize or default.
Questions for listing agent
- What do current leases actually rent for vs. the listed asking? Can we see a recent rent roll and the last 12 months of T-12 income?
- It's been on market 37 days. Have you received any prior offers? Is the seller open to a 86% concession, seller financing, or rate buy-down credit?
- Can we see the unit-by-unit rent roll, current vacancy, and any below-market leases? What's the average tenancy length?
- What capital expenditures (roof, boiler, parking lot, exteriors) have been made in the last 5 years, and what's planned in the next 2?
- Built in 1953 — when were the roof, HVAC, electrical panel, plumbing, and water heater last replaced?
- What's the actual annual flood-insurance premium (NFIP or private), and is the property in a SFHA with mandatory coverage?
- Is there a deadline driving the sale (1031 exchange, divorce, estate, relocation)? That informs how much negotiation room exists.
- Schools are D-rated, which usually means shorter tenancies and higher turnover. Who's the typical renter profile here, and what's been the actual vacancy rate?
CashFlowRE · CFR-BG0KME5JCQF538
· Data 2 days ago
cashflowre.app · 2026-05-29