 Triplex
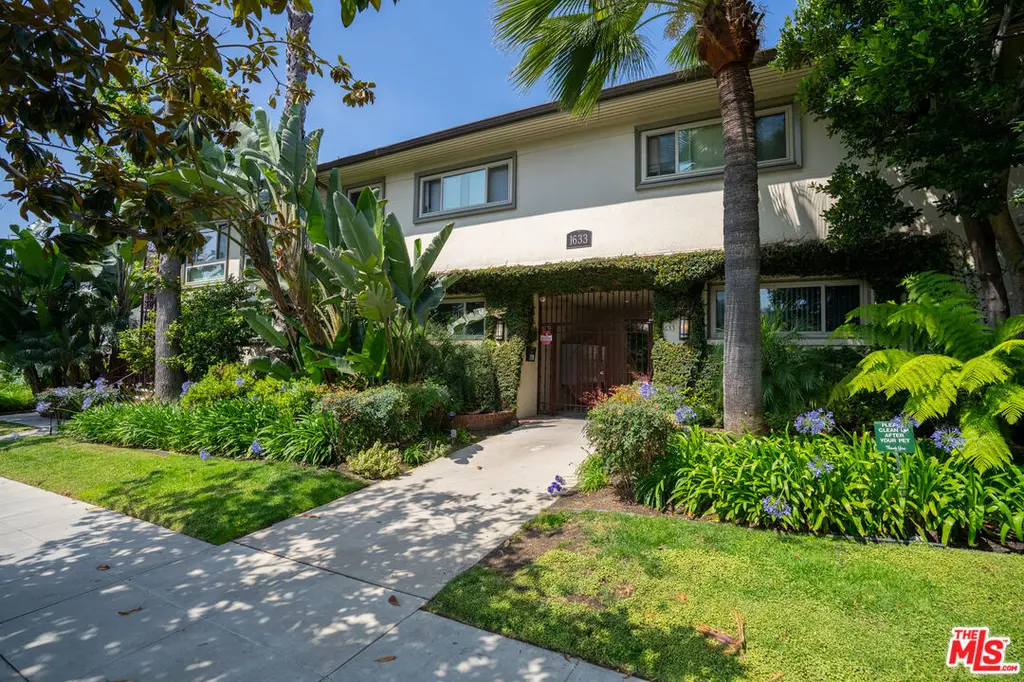
1633 N Laurel Ave · Los Angeles, CA
Flood risk 7/10 · Major
- FEMA flood zone
- X (unshaded)
- Chance of flooding over 30 yrs
- 0.77%
- Est. flood insurance / yr
- $507 – $1,088
Fire risk 2/10 · Minimal
- Est. fire insurance / yr
- $659 – $1,223
Heat risk 6/10 · Moderate
- Hot days now (above 88°F)
- 7 days/yr
- Hot days in 30 yrs
- 22 days/yr
Wind risk 1/10 · Minimal
- Chance of severe wind over 30 yrs
- —
Air-quality risk 5/10 · Moderate
- Unhealthy air days now
- 7 days/yr
- Unhealthy air days in 30 yrs
- 7 days/yr
Risk factors via First Street. Map © Google.
Why this score? — see what drove the F grade
The composite is a weighted blend of 9 inputs, each scored 0–100. Each bar is that input's sub-score; the figure is the points it added to the 100-point composite (weight × sub-score).
- ARV discount +10.4/15.0
- Schools +3.6/10.0
- Livability +3.4/5.0
- Condition / age +2.5/5.0
- Rent growth +2.1/5.0
- Cash flow +0.0/30.0
- 1% rule +0.0/10.0
- DSCR +0.0/10.0
- Appreciation +0.0/10.0
$9,650,000
🖨 Deal sheet 📄 Offer letter ✓ Due diligence
Multi-family units
County records classify this as Multi-Family (5+ Unit). Listing-text estimate: 3 units. estimate disagrees with records
5+ unit building — per-unit beds/baths from public records are typically unavailable; the breakdown below (if shown) is an estimate from the listing text.
Listing remarks MLS
We are pleased to present 1633 N Laurel Avenue, a 30-unit multifamily investment opportunity located in one of Los Angeles' most supply-constrained and consistently high-demand rental markets. Positioned just south of Hollywood Boulevard between Laurel Canyon and Crescent Heights, the property benefits from immediate access to premier lifestyle amenities, major employment centers, and some of the city's most desirable residential neighborhoods. The asset features a well-balanced unit mix of twenty one-bedroom units, eight two-bedroom units, and two three-bedroom units, totaling approximately 29,283 square feet on a 32,692 SF lot, with one parking space per unit and a landscaped courtyard-style layout that enhances tenant appeal and livability. The property has undergone extensive capital improvements, including a new roof, upgraded electrical and plumbing systems, individual unit furnaces, improved common areas, and enhanced security infrastructure, providing operational stability and minimizing near-term capital expenditure requirements. Offered at $9,650,000, the investment generates a current 5.02% cap rate with a path to 6.09% at market rents, representing approximately 16% upside through the mark-to-market of remaining below-market units. The offering equates to approximately $321,667 per legal unit and $329 per square foot, with a current GIM of 12.08 and a market GIM of 10.40. Supported by limited new supply, strong renter demand, and favorable demographics, 1633 N Laurel Avenue represents a stabilized, well-maintained 30-unit asset with meaningful upside in one of Southern California's most desirable rental corridors.
Key facts
- 0.75 acre lot
- 30 parking spots
- Built 1953
Tags
Neighborhood map
What this means for you Summary
Snapshot
- This is a 3 × 14-bed/?-bath units multifamily listed at $9.65M.
Deal economics
- At list price, monthly cash flow is $-47k ($-562k/yr) — negative. Per door: $-16k/mo.
- To cash-flow at today's rent, offer at most $1.37M (85.8% below list).
- To meet the 1% rule (rent ≥ 1% of price), the offer needs to be $1.33M (86.3% below list).
- Recommended offer: $1.33M (86.3% below list) — sets the bar for 1% rule.
- Cap rate 0.5% vs local median 2.1% in Los Angeles — below-typical yield; the buyer is paying a premium for something (appreciation thesis, condition, location) that the cap rate doesn't capture.
Location & tenants
- Location reads 68/100 on livability (#273 in CA) — a middle-class / working-renter tenant base. Strengths: amenities A+, commute A+, employment B; Watch: health & safety C-, schools D+, crime F.
- Los Angeles Unified (urban): math 29% / reading 54% proficiency, ranked #223 of 517 in CA (top 43%) — families likely to look elsewhere, expect single-tenant / working-renter base with shorter leases; 67% free/reduced lunch — lower-income household profile, screen leases tightly.
- Market conditions: Rents soft (-1.5%/yr); 334 active listings in the ZIP; solid renter incomes; 19,697 units permitted in Los Angeles County in 2024 (9,426 in 5+ unit buildings).
- At $13,252/mo this rent would consume 165% of the median local household income ($96k/yr) (locally 5563% of renters already pay >50% of income on rent) — very limited rent-growth headroom before tenants either downsize or default.
Forward outlook
- Local home prices are declining (-3.0%/yr); year-one equity from $67k of loan paydown is wiped out by about $290k of value loss. Plan a longer hold.
- Los Angeles County population projected at +9% by 2050 — modest demand growth; plan on rents tracking national, not racing it.
Negotiation context
- It's been on market 37 days — a 3% lower offer ($9.36M) is reasonable based on typical stale-listing flexibility.
- 2 sale attempts since 2y ago with the ask held roughly flat each time — persistent listings suggest the price (not the market) is what's stuck; bring a comps-based counter.
Risks & watch-outs
- Watch-outs: flood insurance adds $66/mo; built in 1953 — expect roof / HVAC / electrical / plumbing capex.
- Climate carrying-cost: major flood risk; extreme-heat days projected 7→22/yr by 2055 (HVAC capex compounding) — expect insurance premiums to compound above CPI over the hold.
Questions for the listing agent
- What do current leases actually rent for vs. the listed asking? Can we see a recent rent roll and the last 12 months of T-12 income?
- It's been on market 37 days. Have you received any prior offers? Is the seller open to a 86% concession, seller financing, or rate buy-down credit?
- Can we see the unit-by-unit rent roll, current vacancy, and any below-market leases? What's the average tenancy length?
- What capital expenditures (roof, boiler, parking lot, exteriors) have been made in the last 5 years, and what's planned in the next 2?
- Built in 1953 — when were the roof, HVAC, electrical panel, plumbing, and water heater last replaced?
- What's the actual annual flood-insurance premium (NFIP or private), and is the property in a SFHA with mandatory coverage?
- Is there a deadline driving the sale (1031 exchange, divorce, estate, relocation)? That informs how much negotiation room exists.
- Schools are D-rated, which usually means shorter tenancies and higher turnover. Who's the typical renter profile here, and what's been the actual vacancy rate?
- Crime grade is F in this area — have there been break-ins, vandalism, or insurance claims at this property in the last 3 years? What carrier currently insures it and at what premium?
- The area grade is low — what's the realistic commute time and amenity access for the typical tenant pool here? Any planned neighborhood developments (good or bad) we should know about?
- What's the average days-on-market for RENTAL listings here right now (not sales)? A rising rental-DOM trend means longer vacancies and softer asking-rent achievability than the comps imply.
- What's the recent tenant-quality profile in this submarket — average credit score on applications, eviction rate, late-payment / NSF rate, and stable-employment percentage? A property-management company in the area should have these aggregated.
- How much new apartment / multifamily construction is in the pipeline within 1–3 miles? Heavy new supply (>2% of stock underway) typically softens rents 12–24 months out; light construction supports rent growth.
Investment metrics
- 1% rule
- 0.14% ✗
- Cap rate
- 0.47%
- Cash-on-cash
- -20.78%
- DSCR
- 0.08
- GRM
- 60.7
CMA / ARV
- ARV (median comp)
- $10,312,890
- List price
- $9,650,000
- Delta
- -6.43%
- Verdict
- FAIR
- Comps
- 2 within 1.0 mi
Show comp detail 1 sale within ~0.75 mi
| Address | Dist | Beds/Ba | Sqft | Sold | Price | $/sf | Match |
|---|---|---|---|---|---|---|---|
| 1260 N Hayworth Ave | 0.52mi | 41/40.0 (-1) | 25,452 (-13%) | 18mo | $10,100,000 | $397 | 18 |
Match score weights: distance 35% · size 25% · config 20% · recency 20%. Top-matched comps best support the ARV.
Projected returns pro-forma
-3.0% appreciation · 0.0% rent growth · sell at horizon
- IRR
- -61.5%
- Equity multiple
- -0.70×
- Total profit
- $-4,592,708
- Equity at exit
- $1,438,846
- IRR
- —
- Equity multiple
- -1.97×
- Total profit
- $-8,015,044
- Equity at exit
- $834,356
Cash invested: $2,702,000 (down + closing). Projections, not guarantees.
Landlord ↔ Tenant lean methodology
- Overall (CITY)
- 0 Strongly Tenant-Friendly
- State California
- 18 Strongly Tenant-Friendly · D+13
- County
- — inherits STATE
- City Los Angeles
- 0 Strongly Tenant-Friendly · D+22
ZIP-level market 90046
- Rents YoY
- -1.5%
- Active inventory
- 334
- Price-to-rent
- 182.0×
Monthly cashflow live
- Estimated rent
- $13,252 medium interval (Pro) →
- Mortgage (P&I)
- −$50,606
- Tax from tax record
- −$2,637 /mo · $31,646/yr
- Insurance
- −$4,021
- Flood insurance flood zone
- −$66 /mo · $798/yr
- HOA
- −$0
- Vacancy / Maint / Mgmt
- −$2,783
- Net cashflow
- $-46,861
Break-even live
3-unit breakdown (identical units grouped — click to expand)
| Units | Beds | Baths | Est. rent |
|---|---|---|---|
| 3× units | 14 | — | $13,251 |
| #1 | 14 | — | $4,417 |
| #2 | 14 | — | $4,417 |
| #3 | 14 | — | $4,417 |
| Total (3 units) | $13,252 | ||
UW: 25.0% down · 7.5% · 30yr · 1.5% tax · 5.0% vac · 8.0% maint · 8.0% mgmt
Financing live
Cash to close
- Down payment
- $2,412,500
- Closing costs
- $289,500
- Reserves months
- —
- Total cash needed
- —
Loan-product check · same deal, 3 products live
Conventional
25% down · 7.5% · 30yr
- Down + closing
- —
- Monthly P&I
- —
- Monthly cashflow
- —
- DSCR
- —
- Eligible?
- —
Personal DTI + credit; lowest rate.
DSCR
20% down · 8.5% · 30yr
- Down + closing
- —
- Monthly P&I
- —
- Monthly cashflow
- —
- DSCR
- —
- Eligible?
- —
No personal income docs; deal must DSCR.
Hard money
10% down · 12.0% · 12mo
- Down + closing
- —
- Monthly P&I
- —
- Monthly cashflow
- —
- DSCR
- —
- Eligible?
- —
Short-term bridge; refi at stabilization.
Listing history 16 events
-
2026-06-18days on market $9,650,000 Active 37 DOM
-
2026-06-17days on market $9,650,000 Active 36 DOM
-
2026-06-16days on market $9,650,000 Active 35 DOM
-
2026-06-15days on market $9,650,000 Active 34 DOM
-
2026-06-13days on market $9,650,000 Active 32 DOM
-
2026-06-09days on market $9,650,000 Active 28 DOM
-
2026-06-08days on market $9,650,000 Active 27 DOM
-
2026-06-07days on market $9,650,000 Active 26 DOM
-
2026-06-04days on market $9,650,000 Active 23 DOM
-
2026-06-03days on market $9,650,000 Active 22 DOM
-
2026-06-02days on market $9,650,000 Active 21 DOM
-
2026-06-01days on market $9,650,000 Active 20 DOM
-
2026-05-31days on market $9,650,000 Active 19 DOM
-
2026-05-12$9,650,000 Active 1653-char remark
Show marketing remark (1653 chars)
We are pleased to present 1633 N Laurel Avenue, a 30-unit multifamily investment opportunity located in one of Los Angeles' most supply-constrained and consistently high-demand rental markets. Positioned just south of Hollywood Boulevard between Laurel Canyon and Crescent Heights, the property benefits from immediate access to premier lifestyle amenities, major employment centers, and some of the city's most desirable residential neighborhoods. The asset features a well-balanced unit mix of twenty one-bedroom units, eight two-bedroom units, and two three-bedroom units, totaling approximately 29,283 square feet on a 32,692 SF lot, with one parking space per unit and a landscaped courtyard-style layout that enhances tenant appeal and livability. The property has undergone extensive capital improvements, including a new roof, upgraded electrical and plumbing systems, individual unit furnaces, improved common areas, and enhanced security infrastructure, providing operational stability and minimizing near-term capital expenditure requirements. Offered at $9,650,000, the investment generates a current 5.02% cap rate with a path to 6.09% at market rents, representing approximately 16% upside through the mark-to-market of remaining below-market units. The offering equates to approximately $321,667 per legal unit and $329 per square foot, with a current GIM of 12.08 and a market GIM of 10.40. Supported by limited new supply, strong renter demand, and favorable demographics, 1633 N Laurel Avenue represents a stabilized, well-maintained 30-unit asset with meaningful upside in one of Southern California's most desirable rental corridors.
-
2024-08-27historical
-
2024-04-11$10,900,000 Active
ⓘ Source: listings_history table (triggers on properties + properties_extension) + one-shot
backfill from property_details.listing_events for pre-trigger history.
Tax reassessment forecast CA · Resets to sale price
- Current annual tax
- $31,646 · $2,637/mo
- Projected year-2 tax
- $73,340 · $6,112/mo
- Expected delta
- +$41,694/yr (+$3,474/mo · 131.7%)
ⓘ Screening estimate from a state-policy table — verify with the county assessor before closing.
Climate risk First Street
- Flood 7/10 Severe FEMA zone X (unshaded) · 77% chance over 30 yrs
- Wildfire 2/10 Low
- Heat 6/10 Major 7 d/yr ≥88°F today · 22 d/yr by 30 yrs out
- Wind 1/10 Low
- Air quality 5/10 Major 7 unhealthy d/yr today · 7 by 30 yrs out
Nearby sold comps map
Loading sold comps map…
Walkable amenities ~0.75 mi
Loading nearby amenities…
Taxation est. · year 1
- Rental income
- $159,024
- − Mortgage interest
- −$540,550
- − Property taxes
- −$31,646
- − Insurance
- −$49,048
- − Repairs & maintenance
- −$12,722
- − Management
- −$12,722
- − Depreciation
- −$280,727
- Taxable loss
- −$768,391
- Est. tax savings @ 24.0%
- +$184,414
- After-tax cash flow
- $-377,919/yr
For passive investors: Depreciation is non-cash, so a rental often shows a tax loss while cash-flowing — sheltering income. Rental losses are passive: they offset passive income freely, and up to $25,000/yr can offset ordinary (W-2) income if you actively participate and your MAGI is under $100k (phasing out to $0 by $150k); unused losses carry forward. On sale, claimed depreciation is recaptured at up to 25%, and gains may owe capital-gains tax (a 1031 exchange can defer both). Figures are a year-1 estimate at your 24.0% rate — not tax advice; consult a CPA.
Schools (NCES district)
- District
- Los Angeles Unified
- NCES district ID
- 0622710
- Math proficiency
- 29% ▼ -4.00%
- Reading proficiency
- 54% ▲ 10.00%
- Median HH income
- $50,403
- Composite
- 35.67/100
- National rank
- #4875
- State rank
- #223 of 517 in CA
Livability — Los Angeles
- Score
- 68/100
- State rank
- #273
- US rank
- #9237
Category grades
Schools grade is shown separately in the Schools card above.
Census & demographics
- Census place
- Los Angeles, CA
- County
- Los Angeles County · 9,444,647 people
- City population
- 3,838,149
- Metro
- Los Angeles-Long Beach-Anaheim, CA
- Population (ZIP)
- 48,296
- Household income
- $96,250
- Rent vs Own
- Severe rent burden
- 5563.0
Population outlook (Los Angeles County) Hauer SSP2
- Today (2025)
- 10,940,515 people
- By 2030
- 11,256,481 · +2.9%
- By 2040
- 11,729,929 · +7.2%
- By 2050
- 11,948,407 · +9.2%
- By 2075
- 11,818,114 · +8.0%
- By 2100
- 10,842,928 · -0.9%
Race, ethnicity, and origin ACS 2023
- Neighborhood character
- Majority White (65%)
- Race & ethnicity
- White 65% Hispanic / Latino 16% Two or more races 13% Asian 7% Black 5%
- Hispanic origin (detail)
- Mexican 8% Puerto Rican 1%
- Common ancestry
- Scotch-Irish 6% Lithuanian 4% Romanian 4%
- Foreign-born
- 26% · Canada, China, South Korea
- Languages at home
- 71% English-only · Spanish 9% Russian/Polish/Slavic 8% Other Indo-European 3%
Political lean MEDSL · Los Angeles
- 2024 margin
- Solid D (+32.9) · D 64.8% · R 31.9% · Other 3.3%
- 2008→2024 swing
- -7.4pp toward R · 2008: 40.4pp · 2024: 32.9pp
- All cycles
- 2024: D+32.9 2020: D+44.2 2016: D+48.0 2012: D+40.0 2008: D+40.4
Not yet ingested
- Civics
- —
Market trends
- HPI YoY
- ▼ -571.28%
- Current HPI
- 365.8036
- Rent YoY
- ▼ -1.48%
- Metro
- Los Angeles-Long Beach-Anaheim, CA
- State GDP YoY
- ▲ 3.21%
- F500 in state
- 116
Industry mix (Fortune 500 HQ in CA)
| Industry | F500 HQs | Revenue |
|---|---|---|
| Technology | 27 | $1,492B |
|
||
| Financial Services | 3 | $174B |
|
||
| Retail | 3 | $44B |
|
||
| Insurance | 3 | $26B |
|
||
| Media / Entertainment | 2 | $115B |
|
||
| Pharmaceuticals / Biotech | 2 | $62B |
|
||
Price history
-11.5% since first listed3 events — show timeline
- 2026-05-12 Listed $9,650,000 TheMLS
- 2024-08-27 Listing Removed — CRMLS
- 2024-04-11 Listed $10,900,000 CRMLS
Property tax history
+1.7%/yrLatest (2025): $31,646 · +2.4% YoY. Source: county tax records.
Cash-flow waterfall
monthlySold comps — $/sqft
last 12 mo · ≤1 miLoading sold comps…